Abstract
In this work, we modelize trough an abstract mathematical model by computer simulation, the interaction between several social behaviours and a common ecological environment. Each social system consumes resources to satisfy their needs or to repress other behaviours. There is a bound for the sustainable consumption: if this is not surpassed, the consumed resources are recovered without cost (natural cycles, reutilization...). After surpassing it, the recovery has a cost in recycling and the ecological degradation implies the decrease of the satisfaction.
Our model studies the transition conditions toward an ecological balance or the destruction of the environment, the evolution of the consumption, the increase of the satisfaction and measures the development degree of the social systems.
Introduction: the model.
We work with an Adaptive [7], Historical, Geographical and Multidimensional Model with Resignation [9] built from a General Learning Theory [6] which is formulated in terms of General Systems Theory [3]. By means of this Mathematical Model, we have studied the possible paths of evolution from a Full Repressive Society to a Free Scientific Society with a multidimensional state-variable which values characterise social behaviours.
The Model is composed by means of the interaction of several mathematical Systems, which express the relations between the variables involved:
The core of the Model is the Learning System, through positive and negative reinforcement: the probability (P) of each social behaviour (U), in each individual subsystem (N) of a social population, increases when his goal is fulfilled and decreases when it is not fulfilled from this social behaviour. If no social behaviour available to an individual subsystem produces goal fulfilment, then this subsystem can be destroyed. The fulfilment probability (PG) depends on its technical possibility (p), which is weighted by a factor determined by the social organisation (1 s).
This factor is generated by a Repression System: each social behaviour, according to its scope (F) in each individual subsystem, the impact (I) of this on different individual subsystems, and its repressive capacity (k), produces a decrease of this factor for the different social behaviours. Thus, each social behaviour represses the other social behaviours, by decreasing its goal fulfilment.
A Relay System produces a random (a) substitution (g) of an individual subsystem for a "child subsystem" with initial equiprobability (natalis) of every available social behaviour. A "child subsystem" can also occupy (A) the niche of a destroyed subsystem. Thus, relay causes the loss of the information accumulated in the substituted individual subsystem.
Also, a Science System determines the probability of learning (PL) for each social behaviour in each subsystem: the probability of the experience of other subsystems, which is weighted by factors of emission, reception and impact, is added to its own experience. This System expresses the relations of intellectual communication between different individual subsystems.
A Historic System simulates historical evolution through the random (b) increase (d) of the dimension (m) of the state-variable in each subsystem, and therefore of the number of its available social behaviours. The probability of evolution is increased (b) by the existence of social behaviours, which were theoretically not available but are forced by the Science System from the experience of other subsystems. This System expresses technological progress and technological diffusion (we characterise a technologically higher society by a greater capacity of choice between different social behaviours).
An Adaptive System determines the dynamic evolution (Ta) of the repressive capacity in a subsystem, from an initial value (k) -when it is a "child subsystem"- which depends on the might (m), associated to the technological level, and ferocity (n) of the social behaviour-, toward its suffered repression (s). The Adaptation Time Ta expresses the delay in the adaptation of produced repression (s) to suffered repression (s). Thus, with a low delay Ta, the produced repression equals quickly the suffered repression. On the contrary, with a high delay Ta, produced repression remains approximately constant.
A Resignation System expresses the influence of subjective factors through a tendency to a statistical normalisation of the reinforcement from satisfaction and dissatisfaction. We name this tendency "resignation", and express it by a time of delay (Tr) according to a model of Systems Dynamics.
Moreover, a Delay System expresses the decrease of Adaptation Time Ta with might µ, the increase of Resignation Time Tr with ferocity n, by means of the parameters Ka and Kr respectively. Moreover, time Te increases with ferocity and decrease with might by means of a parameter Ke. An Impact System expresses how the impact I on repression and intellectual communication depend on might m and distance (d) between subsystems.
A Natural System expresses a diversity of initial condition natalis of the individual subsystems. In its first version, this System is a rigid System, without neither feedback nor evolution.
The Second Principle of Thermodynamic.
In previous projects the corresponding satisfaction to each social behaviour was depending on a function of the different social behaviours that were designated technical possibility of satisfaction and on a factor to reduce the satisfaction when the suffered repression increased.
In this work, we take that function as a technical possibility of initial satisfaction, which we represent by p0(U), and we add a new factor to obtain the current technical possibility of satisfaction. With this new factor we wish to introduce the increase in entropy that is produced through the manipulation of energy and information. Thus, we introduce the cost that corresponds to a fraction of the energy that is dissipated and to a portion of the information that is lost [1].
The most developed behaviours are characterised by an upper quantity of transformations of resources in which the energy is dissipated, and by an upper transmission of information, and, therefore, by an upper increase of the entropy.
On the other hand, the entropy reduces with the concentration of the behaviours, that is to say, the entropy reduces with the repression. Thus, the technical possibility of satisfaction remains

where Ce is a parameter that represents the entropy. This parameter takes values within a set of initial conditions and whose variation we will study in this work
Ecology and recycling.
With the ecology, we wish to represent the degradation of the environment as a consequence of the consumption in satisfaction and repression. Also, it is associated to a decrease in the possibility of consumption, in satisfaction as well as in repression, in order to recover the environment through the recycling [2] [4].
We will represent the ecology through a global not negative variable E. It starts from an initial value E0 sufficiently great to maintain, during the whole evolution, so much consumption in satisfaction or in repression as the whole of the active subsystems could do. Even, the sum of these consumptions can arrive at its maximum level simultaneously, but it will not be able to stay there by the degradation that the environment would suffer. This variable can arrive to the value zero, situation that we will designate as Ecological Hecatomb. A value that permits this situation is E0 = 2NP.
The consumption in satisfaction and repression contributes to the decrease of the resources, that is to say, of the ecology. It is necessary to define and to characterise the processes which would also permit the increase of this variable, always between their extremes. These processes will be the reutilization and the recycling.
According to our model, the reutilization does not imply any cost at all. Otherwise, the recycling is characterised by a cost that causes a decrease in the consumption in satisfaction, in repression or in both. Actually, we can assimilate the real cost of the reutilization to the recycling and associate the reutilization to the natural cycles and to the crops. We will represent the reutilization and the recycling by r and r respectively [5].
The expressions of the consumption in satisfaction and in repression and the cost of the recycling are respectively
Moreover, the effects of the consumption on the ecology are global; thus we will consider that its influence on the environment is equally expressed for any social behaviour in each subsystem.
As the reutilization is associated with the natural cycles, it is bounded by a fraction of the available resources according to a factor Cl. The variation of this factor will be object of study in this work. Also, we consider that it is bounded by the consumption in satisfaction and in repression and it cannot be negative. The expression
gives us the value of the reutilization.
The recycling is formulated according to an ideal value that corresponds to the consumed and not reutilized resources and it cannot be negative. Thus, we express the ideal recycling by
We will apply a delay
where Ke is an ecological parameter.
Finally, we consider that the maximum possible cost in recycling corresponding to each social component is bounded by its possibilities of consumption. Thus,

Furthermore, the interaction with the environment modifies the satisfaction, represented as PG(U;N), for each social behaviour in each subsystem, increasing with the recovery of the environment but decreasing with the cost of the produced recycling, according to
The family of relationships mathematics used for the formulation of the model is in the address of InterNet http://www.uv.es/~buso/wacra/wacra.html
Specification of the Model
We work with NP = 40 individual subsystems, a maximum dimension mmax = 4 and binary components Ui Î {0,1} of the social behaviour U.
With this specification, U = (0000) would correspond to a Primitive Society with a technical possibility of satisfaction equal to 0, without scientific communication, and which has ferocity but not might, and therefore has no repressive capacity.
In the same way, U = (0111) = 7 corresponds to a Full Repressive Society with technical possibility of satisfaction p = ¾, some scientific communication and full repressive capacity k = 1.
Finally, U = (1111) = 15 = F corresponds to a Free Scientific Society with full technical possibility of satisfaction p = 1, full scientific communication and null repressive capacity k = 0.
We speak about predominance of a state U0 if its probability is the majority [P(U0) > ½] in a relative majority of subsystems.
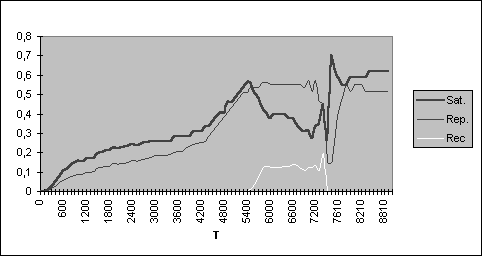
In add we speak about strong predominance if moreover its probability of satisfaction (PG) is the maximum. We are especially interested in processes of evolution with strong predominance of a Full Repressive Society [U = (0111)], by considering that only such processes can simulate the real social evolution on the Earth planet, from current New International Order supported in last chance on nuclear armament. And we wish to find the conditions that facilitate the overcome of this situation.
Also, we wish to study the recovery of the environment after the deterioration associated with the repressive societies.
In the present work we will study how these situations are distributed according to the values that the parameters Cl and Ce take.
We have implemented our model in language C and we have executed it 4.320 times with different initial conditions (Cl, Ce) Î {30, 35, 40,..., 70}x{1 ,2 ,..., 10}, and taking, for each value of (Cl,Ce), 4 values of Ka, 4 of Kr and 3 of Ke according to uniform probability distributions in the sets {1, 2,..., 100}, {1, 2,..., 100}, {1, 2,..., 10}.


Results.
We summarise the results in the table
|
|
|
|
|
|
|
|
|
|
|
|
|
|
|
We represent the proportions in which this strong dominance has arrived in the Figure 3, and the proportions in which this strong dominance has been after surpassed in the Figure 4. In the first case, we have adjusted the evolution of the proportions through least squares and, after comparing with a wide transformation family, we have obtained as better fitting
A 1546% of the evolutions goes through the strong predominance phases and surpasse it. The distribution of these evolutions relative to the parameters Ce and Cl it is the normal function
 .
.

Figure 3
Figure 4
Distribution of Strong Predominance Distribution of surpassed
Strong Predominance
Also, we have studied the proportions in which the Ecological Hecatomb is produced and the proportions in which the ecological recovery is completed (Figures 5 and 6). In this case we have obtained respectively the fittings
The proportion of evolutions that ends with a partial recovery of the ecology is q = 1 p0 p1.


Figure 5
Figure 6
Distribution of Ecological Hecatomb Distribution of Total
Ecological Recovery
Evolution of consumption during the absence of bounds effect.
The exponential growth is a common characteristic to the not bounded models. Therefore, we wait that it also occurred in our model during the absence of bound effect. This absence doesnt only mean that the consumption had not reached its limit: during the temporal interval in which the resources have not decreased, the evolution is equivalent to an evolution without bounds for the consumption, because all the consumed resources have been recovered spontaneously, without cost, by reutilization. We will name tEo to the instant in which the bounds are reached.
It is very important bear in mind that the formulation of the consumption (also the formulation of the other functions that we will study) is accomplished from social terms. The economic considerations are subordinated to the social considerations.
In the initial phase, the predominant behaviours are characterised by a small variation of the values of the technical possibility of satisfaction, which limits the consumption. We will name t0 to the instant in which it concludes the effect of this limit.
We have taken the values of each evolution during the intervals in which
the bounds dont affect to the development, and we have fit the consumption
to functions of the form K(t) = eat + b. Moreover, we have observed
that the transformation t = ![]() =
= ![]() and the expression K(t)
= eat + b proportions better fittings which are independent
of the initial parameters (see Figures 7 and 8).
and the expression K(t)
= eat + b proportions better fittings which are independent
of the initial parameters (see Figures 7 and 8).
The calculations proportion the functions
for the consumption in satisfaction and for the consumption in repression respectively. The coefficients of correlation are r1 = 0991 and r2 = 0988 respectively and the fittings are independents of the initial parameters. Your effect is enclosed in the value of the period T.
The solution of the equation K1(t) = K2(t) proportions gives t0 @ tEo. In the instant tEo the consumption in satisfaction and the consumption in repression have approximately the same value. The sum of both consumptions is
As in this instant the consumption in repression and the consumption in satisfaction always they are approximately the same, we will consider a sustainable bound for the consumption in repression or in satisfaction to half of the sustainable bound for the consumption.


Variation of the consumption in repression after reaching the sustainable bound.
We have seen that, near the instant tEo, the consumption in satisfaction and the consumption in repression coincide and its sum reaches the sustainable bound. In this instant, the consumption in repression finishes the exponential growth and acquires a lineal variation during an interval of significant time. We name ts to the extreme superior.
Then, we will represent the evolution of the consumption by the lineal model.
This trajectory is independent of the initial parameters. This time your effect is included in the value of the extreme superior of the interval.
We summarised the relationship between ecology and repression in the table
|
|
|
|
|
|
|
|
|
|
|
|
If the consumption in repression overcomes the half of sustainable limit, the Ecological Hecatomb probability increases. If the consumption in repression reduces, the Ecological Hecatomb probability reduces. It is not possible to find correlation between the consumption intended for repression and the Ecological Hecatomb probability. When we study both situations we observe that the quantity of consumption in repression depends on the availability on resources and on the capacity to use them, on the other hand, the availability of resources also reduces when the environment is deteriorated additionally by different causes to the repression. In this situation, the model is more sensitive and a smaller aggression is sufficient to provoke the Ecological Hecatomb.
Evolution of the satisfaction during the absence of bounds effect.
We have modelized the satisfaction growth in a similar way that the consumption in repression during this period, by means of a lineal model with
The coefficient of correlation is r = 0981. Moreover, the coefficient is independent of the initial parameters. After the consumption reaches the sustainable bound, the evolution of this function evolves irregular.

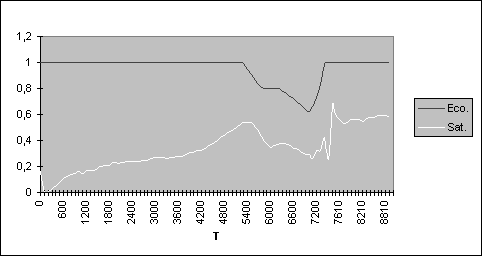
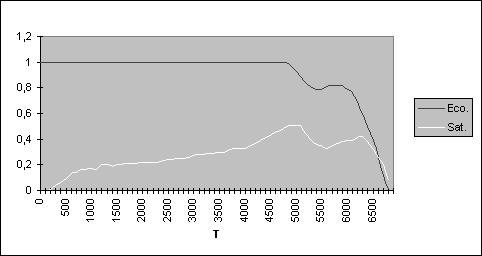
Our model is not aggregate, therefore the end of the evolution in Ecological Hecatomb does not need that this is produced suddenly. It can present a phase releases in the one which the environment suffers the aggression because the subsystems most restrictive induce the destruction of the environment of the subsystems less developed. However, the final effects are global.
In any case is interesting to observe that the satisfaction reduces when the environment is deteriorated. Only a response succeeded before this sign can avoid the Ecological Hecatomb. Response is clear: one must to reduce (or better your reduction) the consumption in repression.

Might Growth.
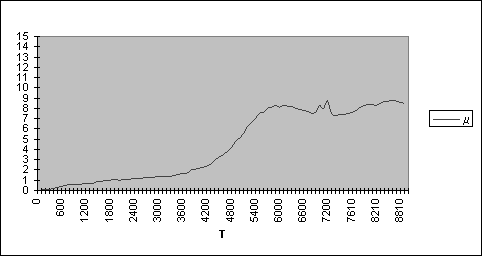
This function is associated to the technological level. The characteristics of the growth of this function are:
Now we should find the interval during which the model is valid, the value of the maximal amplitude A and the value of the half-period t.
The transition from a Full Repressive Society to a Free Scientific Society permits that the might change suddenly: thus, the instant of its appearing, that we will name tFSS, is a superior bound of the valid interval.
As E < E0 from the instant tEo we propose that tEo is the point of inflection of the growth. Therefore, we will take the half-period t = 2tEo. In addition, 2tEo is also a superior bound of the valid interval in order to explain the growth. We will call tf = min[2tEo, tf, tFSS] and we will take the interval [0, tf].
Finally, we will take the amplitude A = ![]() in each trajectory. With these considerations, we get the function
in each trajectory. With these considerations, we get the function
 , t Î[t0,
tf].
, t Î[t0,
tf].This model is independent of the initial parameters. The influence of the parameters is included in tEo. The coefficient of correlation is r = 0992.
Moreover, this model is independent of the presence or absence of the Ecological Hecatomb. Therefore, our model warms that the technological increase does not permit a not bounded yield from the environment.

Ecology and "revolt" effects.
In previous works [8], we were studying the appearance of improbable
behaviours associated with evolutions in those the strong dominance was
appearing and with low values of PG. We recall that now ![]() .
Thus, the reduction of the resources and the cost of the recycling make
more probable the appearance of these effects. However, with the modifications
of the introduced model, we have only obtained quantitative changes in
the appearance frequency, but not qualitative changes in its causes or
consequences.
.
Thus, the reduction of the resources and the cost of the recycling make
more probable the appearance of these effects. However, with the modifications
of the introduced model, we have only obtained quantitative changes in
the appearance frequency, but not qualitative changes in its causes or
consequences.
Interpretation and conclusions.
We have included in our model the parameter Ce to represent the cost of the dissipation of a fraction of the energy according to the Second Principle of the Thermodynamic and the parameter Cl to represent the efficiency in the reutilization of resources associated with the natural cycles.
The variation of the parameters Ce and Cl provides a monotonous variation of the ecological recovery, from the Ecological Hecatomb (when these parameters are very adverse) until the automatic recovery (when they are very good). In the intermediate zone prevails the partial recovery of the resources.
Also, we observe that the consolidation of restrictive social behaviours increases with the adversity of the parameters. However, the possibility of surpassing this restrictive phase does not present monotony with the parameters Ce and Cl: it is accumulated about the point (Ce, Cl) = (480, 5165) (see Figure 4).
The modification of the model only provides a quantitative change on the appearance of improbable behaviours (revolt effect). Now, its cause the decreasing of the resources when the parameters are adverse is more frequent but we do observe neither new causes nor new effects.
According to our model, the growth of the consumption presents a short initial phase in that doesnt admit an exponential model because of the inability of the systems in order to maintain it. Soon this ability is reached and the consumption grows exponentially until reaching the sustainable bound. In this instant, the consumption in repression overcomes the consumption in satisfaction. Later, the consumption in satisfaction evolves irregularly, while the consumption in repression evolves lineally. This fact is very interesting because in some studies, that consider a finite quantity of resources, the exponential growth is immediately and necessarily followed by a collapse. Our model presents a phase in which the consumption could be ecologically adapted to the quantity of available resources. This process is stable if after obtaining it is maintained a sustainable development in which the satisfaction increases when the repression decreases. Other ways conclude in the Ecological Hecatomb.
Also, we can modelize the growth of the might by means of the growing portion of a cosine, which expresses the inflection and the limit of this growth.
In sum, our model follows the trend that considers the limits of the growth, but includes inside the self-model the option between the hecatomb and the survival through an adaptive process of recycling.
References.
1. Atkins P. W., "The Second Law", Freeman, New York & London (1986).
2. Campbell, B., "Human Ecology", Heinemann Educational Books Ltd.,
London (1994).
3. Klir, G. J., "An Approach to General System Theory", D. Van Nostrand
Co., London (1969).
4. Margalef, R., "Ecología", Ed. Planeta, Barcelona (1981).
5. Tamames, R., "Ecología y Desarrollo Sostenible: La Polémica
Sobre los Límites del Crecimiento. (6th edition) Alianza
Editorial, Madrid (1995).
6. Pla-López, R., "Introduction to a Learning General Theory",
Cybernetics and Systems: An International Journal 19, 411-429 (1988).
7. Pla-López, R & Castellar-Busó V., "Model of Historical-Geographical
Evolution", in R. Trappl ed., Cybernetics and Systems94, I, World
Scientific, Singapore, 1049-1056 (1994).
8. Pla-López, R, "Cuánto Puede Perdurar una Revuelta",
I Reunión Española de Ciencias de Sistemas, València,
Ab. 17-19 (1996).
9. Pla-López, R., "Social and Ecological Consequences of Adaptive
Pacifism and Unsubmission", 3e Congrès Europeén
de Systémique, Roma, Oc. 1-4 (1996).