1 · Calibrate
Angular measurements are fitted with a Gaussian model. The measured maximum at each distance is related to the RF reference power obtained from the mathematical beamforming model.
This application supports the experimental study of selected observable characteristics of a directional radio-frequency beam generated through beamforming. The optical platform is not intended to reproduce RF electromagnetic propagation or energy transfer. Instead, it provides an experimentally accessible representation of the angular distribution and equivalent received-power behavior relevant to wireless energy harvesting and energy management.
Angular measurements are fitted with a Gaussian model. The measured maximum at each distance is related to the RF reference power obtained from the mathematical beamforming model.
The calibrated relationship is PRF = PTX α ADCβ. The parameters α and β are obtained with the same logarithmic fitting criterion used in the reference Python procedure.
A new measurement is characterized using its own optical floor. The angular pattern is normalized while preserving its measured peak, converted into equivalent optical power, and compared with the RF reference distribution.
Estimate the RF–optical correspondence from the calibration measurements.
angle/angulo column and distance columns such as 0.5m, 1.0m, 1.5m.The fit uses the reference logarithmic criterion: ln(PRF,max/PTX) = ln(α) + β ln(ADCmax).
Apply the stored calibration to a new angular measurement under its own illumination conditions.
angle/angulo column and one ADC measurement column.The device diagrams are shown here. The actual transmitter and receiver firmware will be added later.
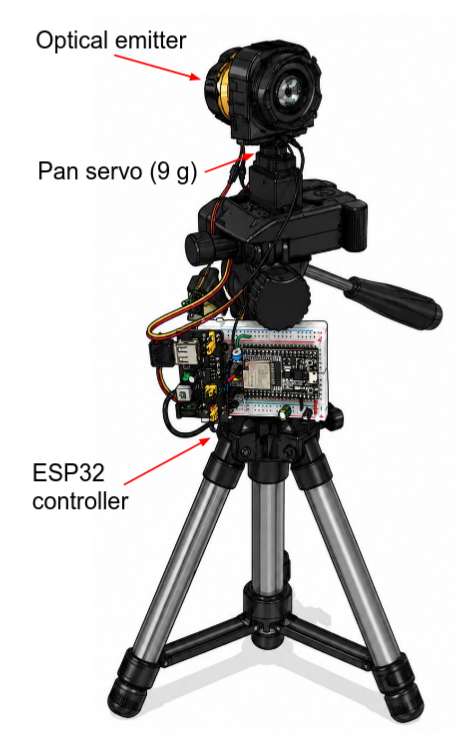
Firmware pending.
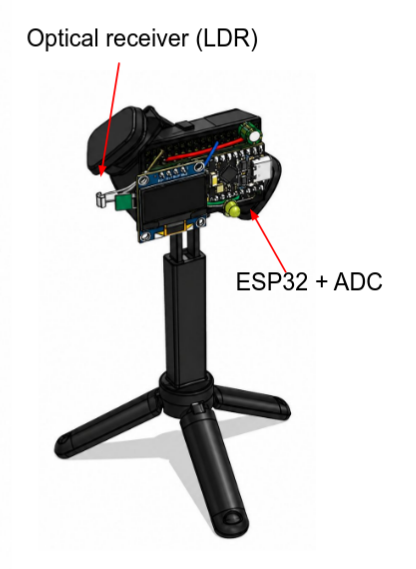
Firmware pending.
Download the measured CSV files associated with the experimental study. The archive is organized into calibration measurements and individual experimental tests.
The files on this page are the original measurement data used with the optical experimental platform. They are provided separately from the processed results so that the measurements can be inspected, reused, and reproduced independently.
Original angular measurements used to obtain the RF–optical correspondence.
Original measured data for experimental test E1.
Original measured data for experimental test E2.
Original measured data for experimental test E3.
Original measured data for experimental test E4.
Original measured data for experimental test E5.
Original measured data for experimental test E6.
CSV files are provided as measured, without replacing the original angular samples with fitted or synthetic values. Processed data generated by the Calibrator and Experimental Test pages can be downloaded directly from their corresponding graphs.