[<][<=][=>]Index of this webpage
**++Climatology from Satellites Group (GCS)++**
**++Research Lines++**
**I ''VALIDATION OF LOW SPATIAL RESOLUTION EARTH OBSERVATION REMOTE SENSING DATA AND PRODUCTS. THE VALENCIA ANCHOR STATION''**
**II ''SOIL & VEGETATION''** (tbc)
**III ''WATER STUDIES''**
**IV ''TERRESTRIAL APPLICATIONS OF GNSS-R, -IR''**
**V ''RADIATIVE BALANCE STUDIES (CERES, GERB, EarthCARE, SEVIRI)''**
**++[The Valencia Anchor Station https://tinyurl.com/yyzc4url]++**
**What is an ''ANCHOR STATION''**? (from Professor H.-J. Bolle † March 2013)
**Rationale**/
**Desirable measurements at ''Anchor Stations''**/
How Representative are the ''Valencia Anchor Stations'' measurements with respect to its surrounding meteorology?
**++Recent Research Projects++**
**++Publications++**
**Other Significant Publications++**
**++Capacity Building & Professional Education in Earth Observation**++
**++Postgraduate Course on ''New Observation and Watching Systems in Meteorology and Climatology''++**
**++Hosting Foreign Young Researchers / Students in Short Stays for I+D+i / Academic Work Activities**++
**++Acknowledgment**++
[<][<=][=>][*]
How Representative are the ''Valencia Anchor Stations'' measurements with respect to its surrounding meteorology?
The application of the Valencia Anchor Station to validation activities of low spatial resolution Earth Observation remote sensing missions makes it necessary to study the representativity and significance of the actual meteorological station measurements with respect to the area that it represents.
Meteorological simulations carried out with The Atmospheric Pollution Model (TAPM) (Hurley, 2005) were performed for the whole year of 2004 with the temporal resolution of 1 h (Vidal et al., 2007). The spatial resolution was 1 km, covering a total area of 75 x 75 km2. The grid was chosen such that the Anchor Station is placed in the central point, that is, the coordinate (38, 38).
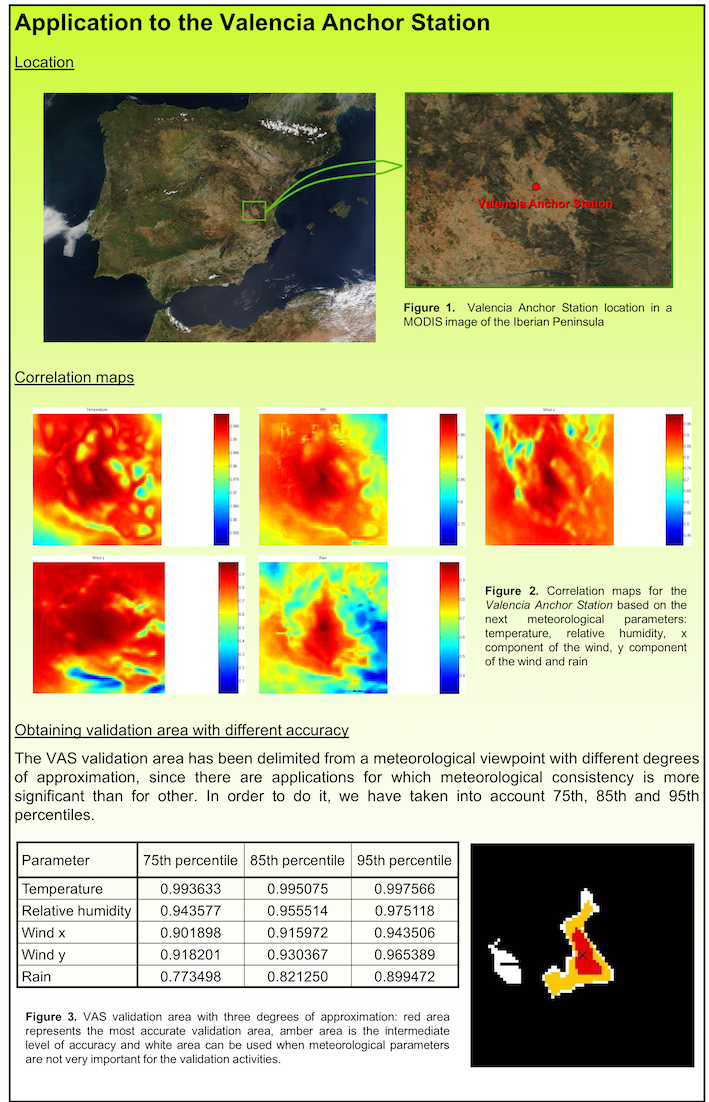
The correlation between the simulated time series for every grid point and the Anchor Station simulated values was established by means of the Pearson's correlation coefficient. The following figure shows the correlation maps obtained for the parameters analysed, namely, temperature, relative humidity, u and v wind components, and precipitation.

Correlation maps centered at the Valencia Anchor Station relative to the meteorological parameters: a) temperature, b) relative humidity, c) u wind component, d) v wind component, e) precipitation (Vidal et al., 2007)
A limit was established in the correlation coefficients for each of the parameters. The zone of influence of the whole station was taken as the intersection of the zones obtained for each of the parameters. Instead of using five correlation coefficients -one for each parameter-, a specific percentile value, namely, 75, 85, 95, was chosen as limiting value for each of the correlation coefficients, thus defining different approximations degrees. The values of the limiting correlation coefficients relative to each meteorological parameter and for each proposed percentile are given in the Table shown in the figure above.
The graphical representation of the intersection of the areas obtained for each meteorological parameter is also shown in the bottom right figure above, where the red area represents the intersection of the zones obtained for each parameter taking as limiting R values those obtained for percentile 95; the yellow area for percentile 85 and the white area for percentile 75. The black area shows lower correlation values.
References
• Hurley P. (2005): The Air Pollution Model (TAPM) Version 3. Part 1: Technical Description, CSIRO Atmospheric Research Technical Paper No. 55
• Vidal,S.; C. Narbon, A. Cano, E. Lopez-Baeza (2007): Methodology for the Definition and Delimitation of Validation Areas for Remote Sensing Algorithms and Low-resolution Products. Application to the Valencia and Alacant Anchor Stations. IEEE International Geoscience and Remote Sensing Symposium, Barcelona, Spain, 23-27 July 2007

