[<][<=][=>]Index of this webpage
**++Climatology from Satellites Group (GCS)++**
**++Research Lines++**
**I ''VALIDATION OF LOW SPATIAL RESOLUTION EARTH OBSERVATION REMOTE SENSING DATA AND PRODUCTS. THE VALENCIA ANCHOR STATION''**
**II ''SOIL & VEGETATION''** (tbc)
**III ''WATER STUDIES''**
**IV ''TERRESTRIAL APPLICATIONS OF GNSS-R, -IR''**
**V ''RADIATIVE BALANCE STUDIES (CERES, GERB, EarthCARE, SEVIRI)''**
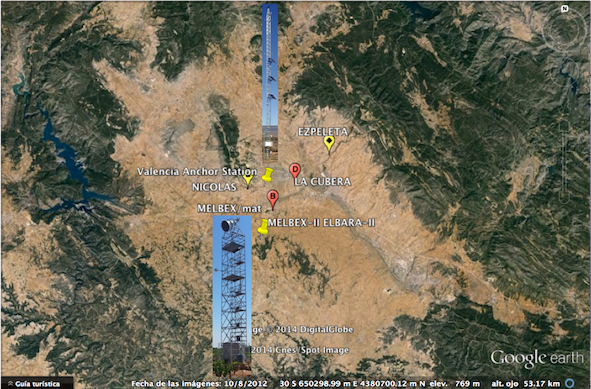
**++[The Valencia Anchor Station https://tinyurl.com/yyzc4url]++**
**What is an ''ANCHOR STATION''**? (from Professor H.-J. Bolle † March 2013)
**Rationale**/
**Desirable measurements at ''Anchor Stations''**/
How Representative are the ''Valencia Anchor Stations'' measurements with respect to its surrounding meteorology?
**++Recent Research Projects++**
**++Publications++**
**Other Significant Publications++**
**++Capacity Building & Professional Education in Earth Observation**++
**++Postgraduate Course on ''New Observation and Watching Systems in Meteorology and Climatology''++**
**++Hosting Foreign Young Researchers / Students in Short Stays for I+D+i / Academic Work Activities**++
**++Acknowledgment**++
[<][<=][=>][*]
**++[The Valencia Anchor Station https://tinyurl.com/yyzc4url]++**

What is an ANCHOR STATION? (from Professor H.-J. Bolle † March 2013)
Anchor Stations are instrumented sites to measure in representative areas quantities which are needed to
• run
• calibrate
• validate
models and algorithms e.g. such as those needed to quantitatively evaluate satellite data and convert them into geophysical information.
The stations must be instrumented with equipment for long time measurements of basic quantities (meteorological and hydrological background data) and, in addition, for quantities that are not readily assessed at operational meteorological and hydrological stations.
Anchor Stations, furthermore, must offer the infrastructure to undertake more refined measurements for shorter intensive observation periods in the surrounding of the station.
In addition to background quantities (temperature, moisture, pressure), they should also be measured:
• fluxes (surface albedo, the four components of net radiation, soil heat flux, sensible and latent heat flux, carbon fluxes, water fluxes in the soil),
Bowen ratio
• spectral atmospheric optical depth
• atmospheric water vapour
• aerosol parameters
• ground water level
• soil moisture
• vegetation parameters (type, height or z0, resistances, biomass, NPP, LAI)
Not all Anchor Stations need to measure all parameters permanently
Rationale/
Mesoscale models
can in principle be operated with little instantaneous input from ground observations if topography and synoptic scale flow are known. Whether they produce the correct interactions with the surface (momentum, energy and mass fluxes) must be checked at least occasionally by direct measurements
Hydrological models
The same is true. In their case, it has to be validated whether they produce the correct soil moisture and run-off
Satellite data
are evaluated with complicated algorithms that tie the measured radiances to surface properties. These algorithms have to be tested against direct measurements and satellite instruments have to be re-calibrated

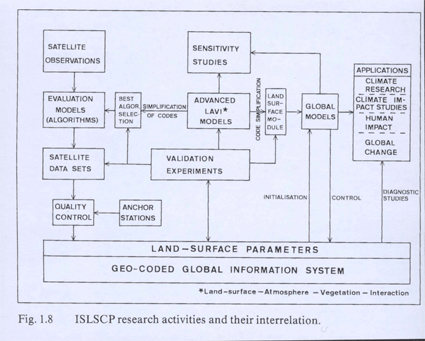
(From F. Becker, H.-J. Bolle and P.R. Rowntree, 1988, The International Satellite Land Surface Climatology Project)
Climate models
Not only need in addition to meteorological data carbon dioxide and other trace gas fluxes, they also need, according to the latest results, aerosol data. Anchor Stations should therefore also be equipped with instrumentation for spectral optical depth measurements or other kind of equipment that provides information about aerosol concentrations and types. The state of vegetation can, to some degree, be estimated from satellite observations. The conclusions from such kind of measurements may, however, be misleading if no ground truth is available
Desirable measurements at Anchor Stations/
Continuously:
• Atmospheric transmittance (spectral)
• Net radiation flux; preferable all four radiation fluxes plus in addition independently the net flux
• Bowen ratio (including the measurements of air temperature and humidity at two levels)
• Soil heat fluxes and temperatures at least at four levels
• Precipitation
• Soil moisture at three levels: near surface, intermediate, root layer
• Effective radiation temperature of the surface
• Ground water (piezometric) level
Occasionally (especially under extreme situations):
• Sensible and latent heat fluxes separately by advanced methods (e.g. eddy correlation)
• Vegetation parameters such as leaf area index (LAI), fractional coverage, biomass area density, stem flow, stomata resistance, vegetation height, vegetation structure, leaf orientation & size
• Land use at and around the station
From time to time at longer intervals:
• Soil quality
• Radiometric characteristics (e.g. reflectance function)
At the central data bank the following derived quantities have to be computed from the measured values:
• Wavelength dependent optical depth and vertical distribution of water vapour mass as needed for the correction of satellite data. The goal must be to derive a climatology of aerosol optical properties for the region. If reliable algorithms become available to compute atmospheric corrections from measurements made in space, this network serves the validation of these algorithms and the quality control of atmospheric corrections. This task can be supported by measurements made in the areas of the anchor stations by aircraft in order to obtain a better areal coverage.
• Daily and monthly values of all flux components (radiation, sensible heat, latent heat, soil heat flux respectively heat storage in the soil).
• Soil moisture as the difference between precipitation, latent heat flux, and storage.
• Ratio of directional reflectance to albedo (according to models parametrized with respect to the measured quantities that are still to be developed).
• Surface conductance.

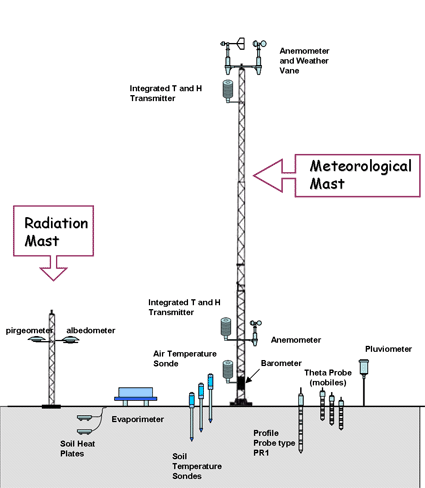
Instruments on the Valencia Anchor Station
How Representative are the Valencia Anchor Stations measurements with respect to its surrounding meteorology?
The application of the Valencia Anchor Station to validation activities of low spatial resolution Earth Observation remote sensing missions makes it necessary to study the representativity and significance of the actual meteorological station measurements with respect to the area that it represents.
Meteorological simulations carried out with The Atmospheric Pollution Model (TAPM) (Hurley, 2005) were performed for the whole year of 2004 with the temporal resolution of 1 h (Vidal et al., 2007). The spatial resolution was 1 km, covering a total area of 75 x 75 km2. The grid was chosen such that the Anchor Station is placed in the central point, that is, the coordinate (38, 38).
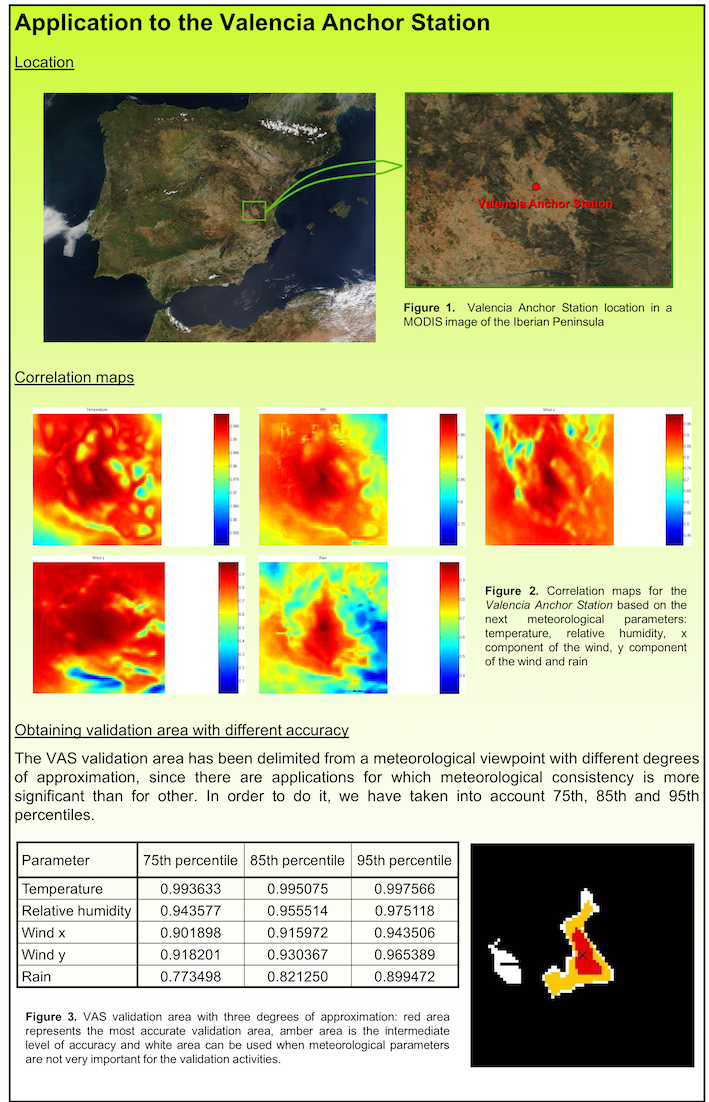
The correlation between the simulated time series for every grid point and the Anchor Station simulated values was established by means of the Pearson's correlation coefficient. The following figure shows the correlation maps obtained for the parameters analysed, namely, temperature, relative humidity, u and v wind components, and precipitation.

Correlation maps centered at the Valencia Anchor Station relative to the meteorological parameters: a) temperature, b) relative humidity, c) u wind component, d) v wind component, e) precipitation (Vidal et al., 2007)
A limit was established in the correlation coefficients for each of the parameters. The zone of influence of the whole station was taken as the intersection of the zones obtained for each of the parameters. Instead of using five correlation coefficients -one for each parameter-, a specific percentile value, namely, 75, 85, 95, was chosen as limiting value for each of the correlation coefficients, thus defining different approximations degrees. The values of the limiting correlation coefficients relative to each meteorological parameter and for each proposed percentile are given in the Table shown in the figure above.
The graphical representation of the intersection of the areas obtained for each meteorological parameter is also shown in the bottom right figure above, where the red area represents the intersection of the zones obtained for each parameter taking as limiting R values those obtained for percentile 95; the yellow area for percentile 85 and the white area for percentile 75. The black area shows lower correlation values.
References
• Hurley P. (2005): The Air Pollution Model (TAPM) Version 3. Part 1: Technical Description, CSIRO Atmospheric Research Technical Paper No. 55
• Vidal,S.; C. Narbon, A. Cano, E. Lopez-Baeza (2007): Methodology for the Definition and Delimitation of Validation Areas for Remote Sensing Algorithms and Low-resolution Products. Application to the Valencia and Alacant Anchor Stations. IEEE International Geoscience and Remote Sensing Symposium, Barcelona, Spain, 23-27 July 2007

