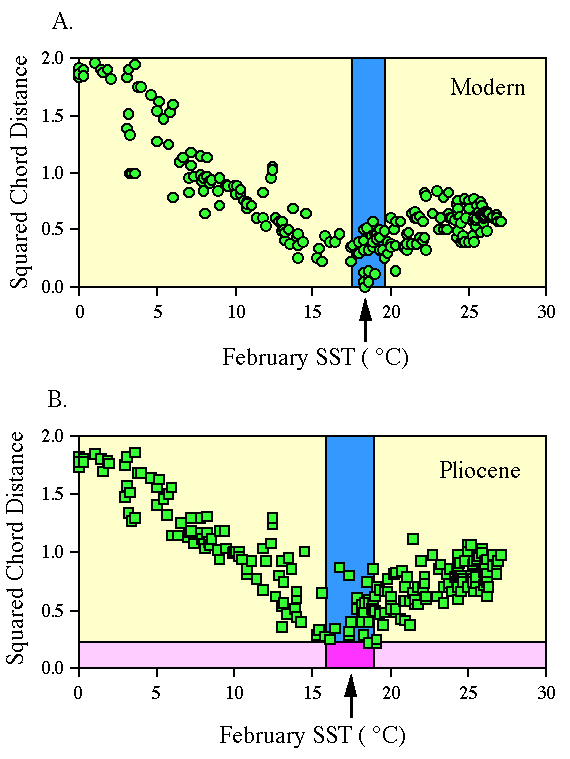
Figure 1. Scatter diagrams of winter sea surface temperature (SST) (íC) versus squared chord distance (SCD) values between (A.) a modern planktonic foraminifer sample and 223 modern North Atlantic planktonic foraminiferal faunal analyses and (B.) a middle Pliocene sample from Deep Sea Drilling Project (DSDP) Hole 606 and the 223 modern core top samples. Twenty-one counting categories were used in these comparisons. Vertical blue bands indicate standard deviation about mean (shown by arrow) of 10 closest anologs to test samples. Horizontal pink band in lower panel highlights the no analog region of SCD values.
