![]()
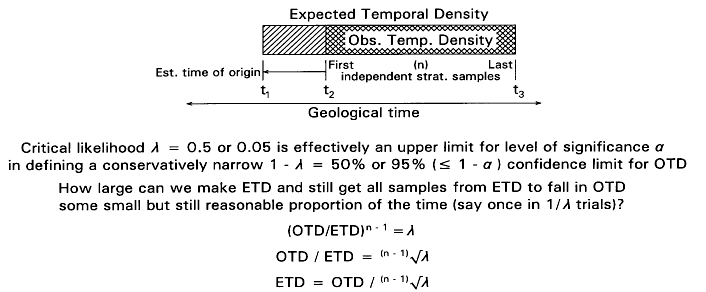
| Figure 1.
Geometric relationship of the observed temporal range or
density, OTD, for a taxon of interest, and the estimated
temporal range or density, ETD, which is the sample space
from which OTD is inferred to have been drawn. OTD is
cross-hatched here and in following illustrations. ETD
involves a one-tailed extension of OTD backward in
geological time from t2 to an
inferred time of origin at t1. The
sample space here is uniform, meaning that it has a
constant width and there is a constant probability of
drawing a sample from any part of the linear range of
ETD—making OTD µ (t3 - t2)
and ETD µ (t3 - t1)—this
simplification is relaxed in the applications considered
here. For purposes of inference, sample size n
is restricted to the number of stratigraphic samples in
OTD drawn independently from ETD (total sample size in
OTD could of course be much larger than n if
recovery of one sample led, directly or indirectly, to
recovery of others). The probability that a sample drawn
from ETD falls in OTD is the ratio of areas (or volumes)
OTD/ETD, the probability two samples drawn independently
from ETD both fall in OTD is the product of their
independent probabilities, and the probability n
- 1 independent samples from ETD fall in OTD is
consequently (OTD/ETD)n-1 (we consider
observed t2 and inferred t1
to be a function of n - 1 samples rather than
all n because one sample is committed to fix the
end of both OTD and ETD at t3). Likelihood estimation involves comparison of the relative likelihoods of different hypotheses concerning t1 and ETD, where the likelihood of a particular hypothesis is proportional to the probability of the observed results, n samples in OTD, for that hypothesis: k · P(OTD, n|ETD), with k being an arbitrary constant. Given the geometric model shown here and the observed results, n samples falling in OTD, the hypothesis about t1 and ETD that has maximum likelihood is the hypothesis that t1 = t2 and ETD = OTD. Maximum likelihood, by convention, has an associated likelihood ratio L of k · P divided by itself: L = (k · P)/(k · P) = 1, and competing likelihood ratios are necessarily smaller, lying in the range 0 to 1. Note that while P less than or equal to 1, there is always a likelihood ratio L = 1 and L is consequently an upper bound for P. How small a likelihood ratio L is acceptable depends on our choice of a critical likelihood or critical likelihood ratio l. In the following applications we consider two values of l, l = 0.5 and l = 0.05; these are upper limits for ordinary levels of significance a = 0.5 and a = 0.05 and hence define conservatively narrow 50% and 95% confidence limits for t2 and OTD in terms of an hypothesized origination time t1 and ETD. In general, ETD = OTD / (n-1)Öl and we are interested to know how large we can make ETD and still expect all samples from ETD to fall in OTD in 1 out of 1/l trials—in other words, how large can ETD be and still yield OTD some small but still reasonable proportion of the time? |
 |