![]()
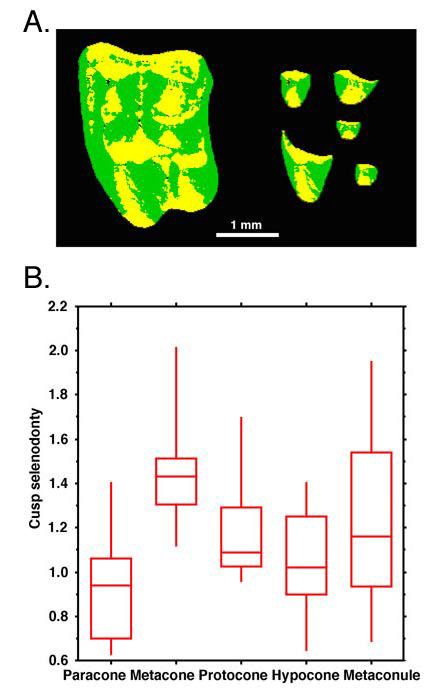
Figure 7. Cusp-shape elongation (selenodonty) quantified with GIS software (MapFactory by Thinkspace). A. False-color image of an erinaceid (hedgehog) upper second molar (Galerix sp., Utrecht University, The Netherlands, from Teruel-Alfambra, Spain). Anterior (mesial) is toward the left, and lateral (buccal) toward the top. The longitudinal (yellow) and transverse (green) slopes are identified from DEMs. This can be done for the whole crown (left) or separately for each cusp (right). B. Plot of the ratio of the longitudinal slope area vs. transverse slope area for a sample of 15 Galerix sp. upper second molars. Larger values correspond to longitudinal elongation of cusps (selenodonty). Note the large difference in selenodonty between the paracone and the metacone even though the degree of their selenodonty is positively correlated (r = 0.67, P < 0.01). Boxes show upper and lower quartiles, horizontal lines represent the mean, and the whiskers represent the range.