- A sample mean is expected to more or less approximate its population mean. This permits us to use the sample mean to test a hypothesis about the population mean.
- The standard error provides a measure of how well a sample mean approximates the population mean. If we know the population standard deviation or variance, the standard error formula is:
If we don't know the population standard deviation or variance we use the sample's standard deviation or variance to obtain an estimate of the standard error. The formula for the estimate of the standard error is: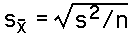
- To quantify our inferences about the population, we compare the obtained sample mean with the hypothesized population mean. If we know the population standard deviation or variance we compute a z-test statistic. The formula is:
If we don't know the population standard deviation or variance we compute a t-test statistics. The formula is: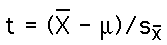
The details of some of the steps differ: The method of determining the critical region depends which one-sample test we are using, and, of course, we way we calculate the (estimate of the) standard error differs for T and Z.
- State the Hypotheses:
- Ho: The null hypothesis This states there is no effect (two-tail), or that the effect is not in the direction we anticipate (one-tail).
- H1: The alternative hypothesis. This hypothesis states that there is an effect (two-tail), or that the effect is in an anticipated direction (one-tail).
- (Classical Approach): Set the decision criteria.
- Specify the significance level.
This is the same for both one-sample tests. Often times we state
- Determine the critical value. The details depend on the test:
Z-Test: We use the alpha-level to find the critical Z value in the Z table.
T-Test: We use the alpha-level and the degrees of freedom to find the critical T value in the T table.
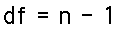
Notice that there is a new complication in using T: There isn't just one T-distribution that we use to determine the critical value of T. There is a whole family of distributions. The distribution depends on the "degrees of freedom".
For the one-sample T-test, the degrees of freedom is simply equal to one less than the sample size. That is:
- Gather Data .
- Evaluate the Null Hypothesis .
- Classical approach (used when doing problems by hand):
- Determine the (estimate of the) standard error of the mean.
- Calculate the test-statistic value (this is the "observed" test statistic value).
- Determine if the observed test-statistic value is in the critical region.
- Decision: If the observed test-statistic value is in the critical region, reject the null hypothesis Ho. If it isn't, do not reject the null hypothesis.
- Modern Approach (used when using statistical software):
- Determine the observed test-statistic value and its exact significance level.
- Report the values and interpret their implications for the null hypothesis.
This step is the same for both one-sample tests. We actually state two hypotheses:
This step is the same for both one-sample tests.
Chapter 11 presents T-Tests for the situation where there are two related samples of scores. This situation commonly occurs in the repeated-measures experimental study. It can also occur in the matched-subject experimental study. These designs are sometimes called dependent sample studies or within-subject designs.
- Repeated-Measures Study
- A repeated-measures study is one in which a single sample of subjects is used to compare two (or more) different treatment conditions. Each individual is measured in one treatment, and then the same individual is measured again in the second treatment. Thus, a repeated-measures study produces two (or more) samples of scores, but each sample of scores is obtained from the same sample of subjects. (Note we have an ambiguous usage of the word "sample" here).
- Matched-Subject Study
- A matched-subject study is one in which each individual in one sample is matched with a a subject in another sample. The matching is done so that the two individuals are as equivalent as possible with respect to a specific variable (or variables) that the researcher would like to control.
- Dependent Samples
- Related samples are sometimes called "dependent samples" because the values observed in one sample of scores "depend" on those observed in the other sample of scores.
- T-Statistic for Related Samples
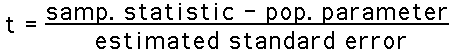
- The T-Statistic for two related samples uses the generic T-Statistic formula:
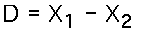
The specific T-Statistic for two related samples is identical to the T-Statistic for a single sample, except that the statistic is defined on the differences between the scores for the two related samples. Thus:- Sample Statistic : The difference score for the subjects is simply the second score minus the first:
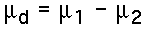
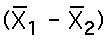
- Population Parameter : The hypothesized difference between the two population means:
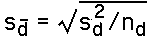
- Estimated Standard Error : The estimated standard error of the difference scores is defined exactly as for the single sample T-Statistic, except that everything (mean, standard deviation, n, etc.) is defined on the differences:
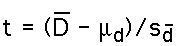
- T-Statistic : T is defined just as with a single sample, except that is defined on difference scores. It becomes:
- Hypothesis Testing : Hypotheses are constructed just as before, except that they are about the differences (usually involving hypotheses about zero differences). The possible pairs of one-tail and two-tail alternative and null hypotheses are:
The T-value is then evaluated just as before, using degrees-of-freedom ofOne Tail, Less Than 0 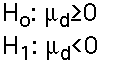
Two Tail 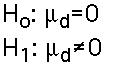
One Tail, Greater Than 0 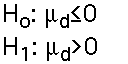
- Example: Asthma Attacks
- A researcher in behavioral medicine believes that stress often makes asthma symptoms worse for people who suffer from this respiratory disorder. Therefore, the researcher decides to study the effect of relaxation training on the severity of their symptoms.
A sample of 5 patients is selected. During the week before treatment, the investigator records the severity of their symptoms by measuring how many doses of medication are needed for asthma attacks. Then the patients receive relaxation training. For the week following the training the research once again records the number of doses used by each patient.
Hand Calculations: The classical hypothesis testing steps are:
- State the hypothesis: We test the hypothesis that there will be fewer medication doses used after relaxation than before (before minus after will be positive). Note that this differs from the book, where they use a non-directional test. Thus we have:
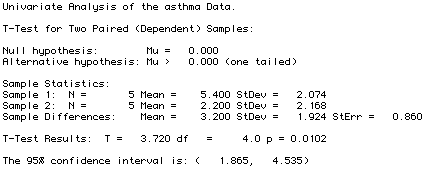
- Set the decision criteria : We use alpha=.05, one tail, for df=4. We find the critical T-value is 2.132.
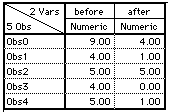
- Gather the data : Here is ViSta's datasheet for the Asthma data:
- Evaluate the hypothesis : The mean difference is 3.2 (3.2 fewer doses after relaxation). The variance of the differences is 3.7. The estimate of the standard error of the difference scores is .86. We now calculate T=3.72. Since T is in the critical region we reject the null hypothesis that there is no reduction in the number of medication doses after relaxation.
Computer Calculations: ViSta can be used to analyze these data, as specified in the ViSta Applet. We specified a directional T-Test: There will be fewer medication doses used after relaxation than before. Note that this differs from the book, where they use a non-directional test. We selected the "before" variable as the first variable and the "after" variable as the second one (the second variable is subtracted from the first).
We obtained the following workmap:
The analysis produces the following report, which corresponds with the hand calculations:
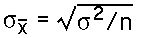
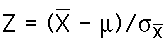
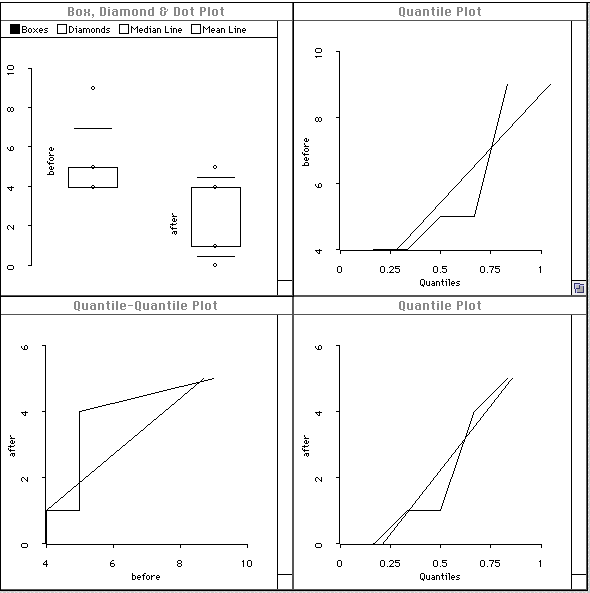
The analysis also produces the following visualization. The plots suggest that the data are not normally distributed, since the jagged lines don't follow the straight line in the quantile plots and quantile-quantile plot, and since the boxes in the box and diamond plot are not symmetric.
This situation is probably the most common experimental design in Psychology. These designs are sometimes called between-subjects or between-groups designs.
T-Test for Two Independent Samples
Example:
The data report for the ViSta Data is:
The ViSta Applet for these data yields the following workmap:
We analyze these data using a one-tailed test based on a directional hypothesis that the directed reading activity will improve reading ability scores (that the "Treatment" group will have higher scores than the "Control" group).
The analysis of these data produces the following model report:
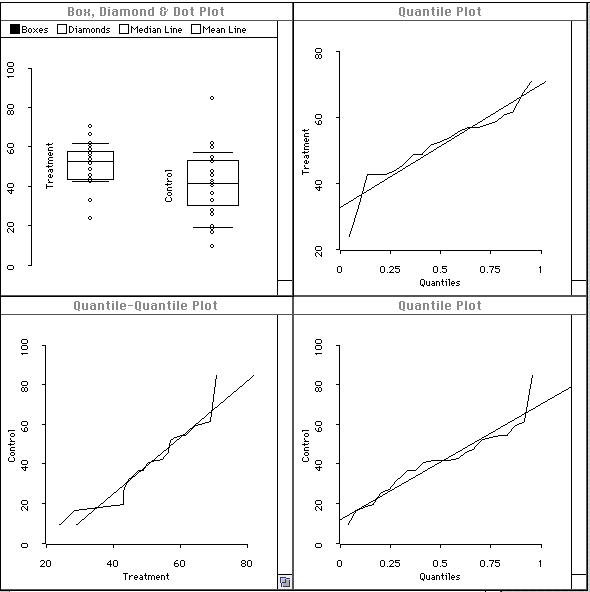
As pointed out in the chapter, the significance test requires that the data come from populations that are normally distributed with equal variance. The visualization helps us see whether these assumptions are met.
Normality: Interpreting features of these plots discussed above, we conclude that the data are reasonably normal.
Equal Variance: The box-plot, however, reveals that there may be more variation in the control group than in the treatment group (the box for the control group is taller than for the treatment group, and the observation dots cover a wider range for the control group). This may mean that the value of p (.0129) may be too optimistic. We note that we have one outlying control group value. Perhaps we should remove it and reanalyze the data.
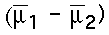
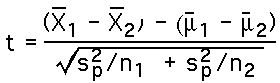
Once again, the generic formula for the T-Statistic is:
For the Independent Samples T-Statistic:
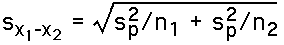
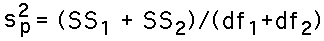
This formula for the estimated standard error uses the "pooled" (combined) errors for the two sample means. The formula for this is:
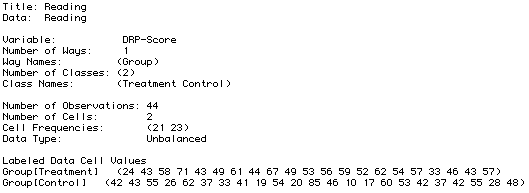
We use data concerning reading ability. (These data are from page 543 of Moore and McCabe.) The data come from a study in which an educator tested whether a new directed reading activity help elementary school pupils improve their reading ability. The two groups are a classroom of 21 students who got the activity (the "Treatment" group), and another classroom of 23 students who didn't (the "Control" group). All students were given the Degree of Reading Power test.
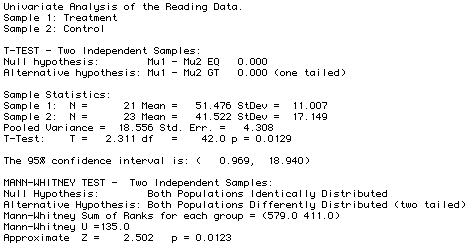
From this report we observe that p=.0129. Thus, we conclude that we can reject the null hypothesis that the reading activity did not improve reading ability scores, and that the reading activity had a "significant statistical effect" on the reading ability scores.