Kinetics and equilibrium 1
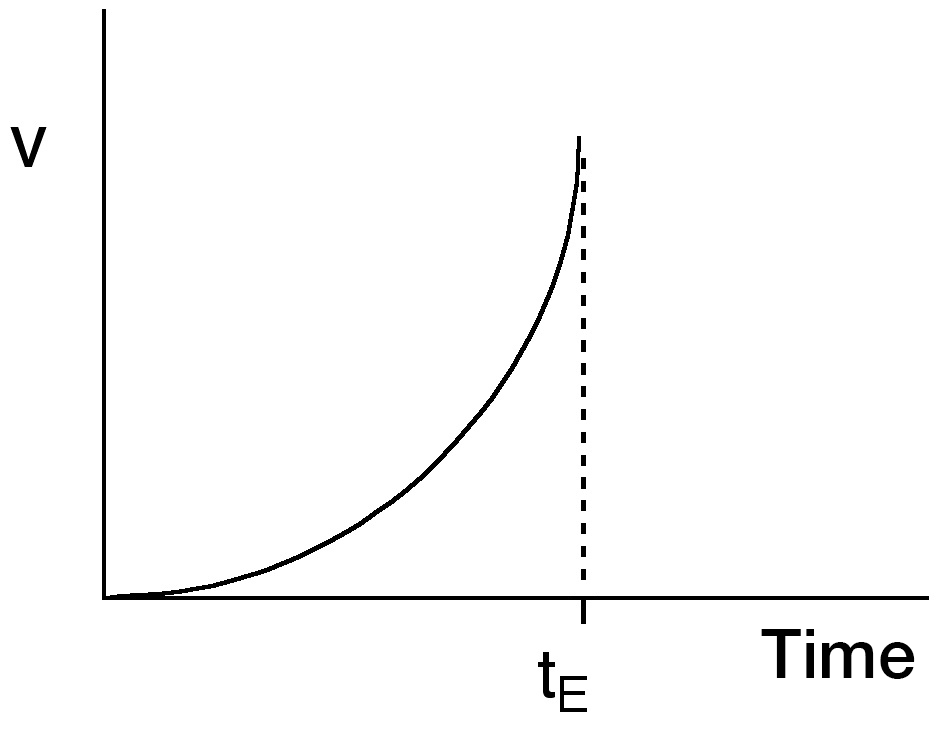
The following graphs represent the variation of the rate of a direct reaction vs time. Which of the graphs represents the system reaching a state of chemical equilibrium at time tE? Click on the selected image.
Wrong
|
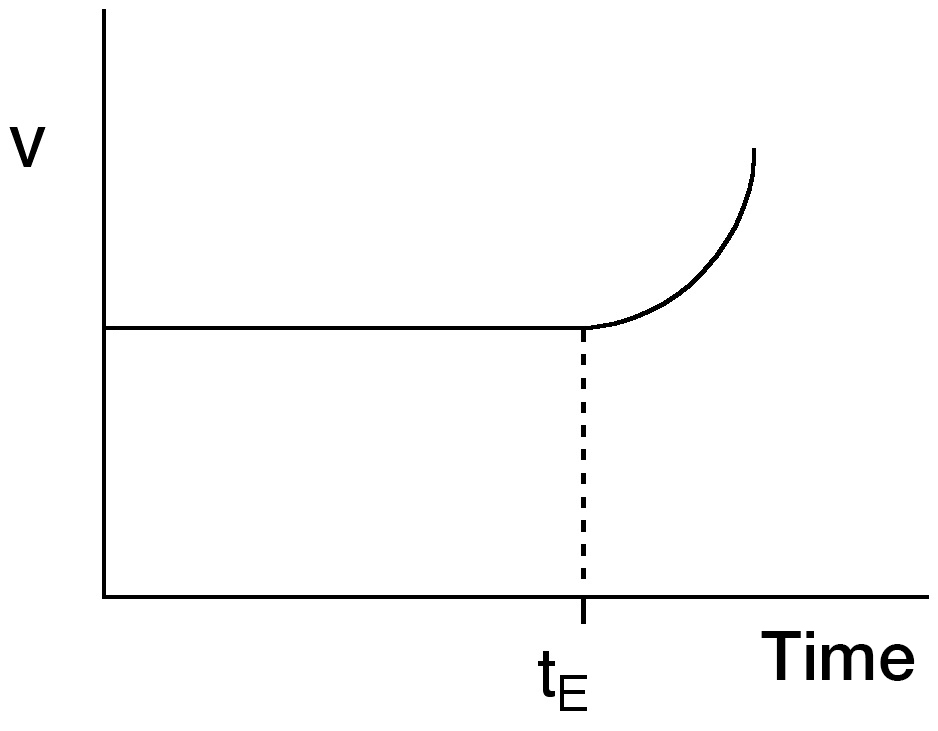
Wrong
|
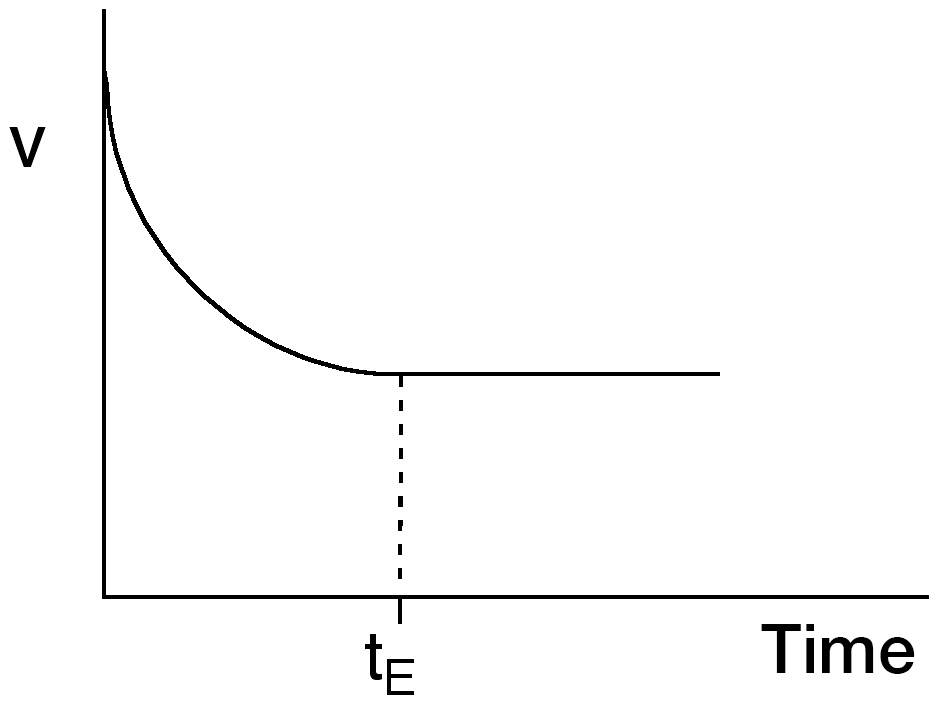
Correct
|
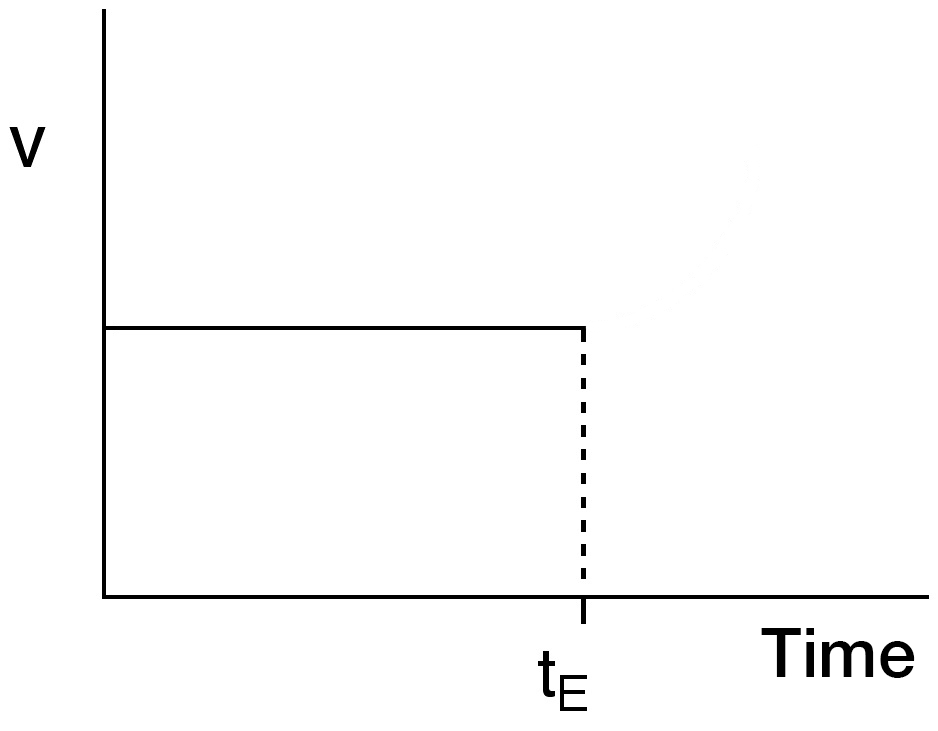
Wrong
|
 |
 |
 |
 |
![]()
![]()