Gases 6
![]()
![]()
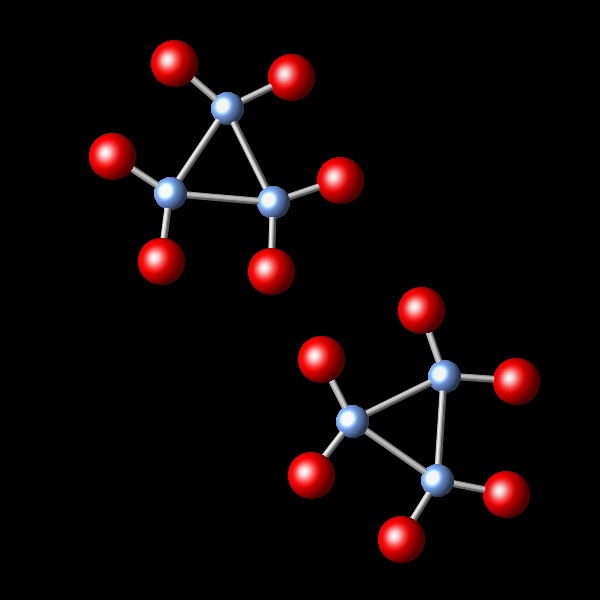
The figure below represents a gas enclosed in a container.
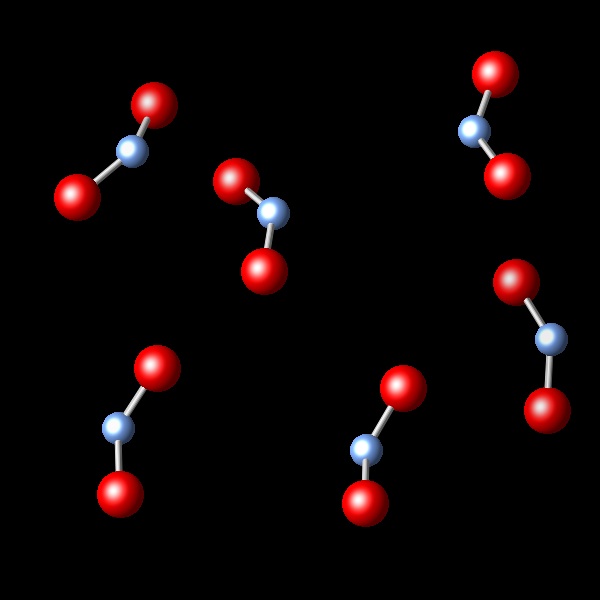 |
A chemical reaction takes place, keeping the pressure and temperature constant. It is observed that the initial volume of 2.4 L is reduced to 1.2 L after the reaction. Which of the following diagrams best represents the resulting reaction products?
 |
 |
 |
 |
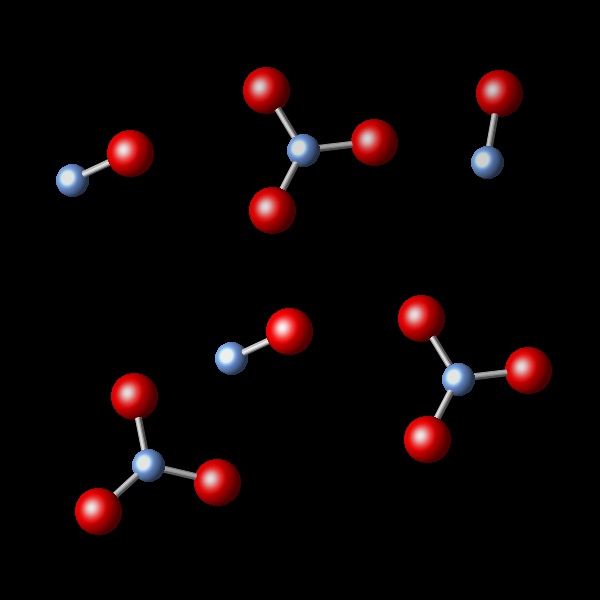
Wrong. In this figure only half of the starting molecules are shown. No reaction took place.
|
|
Correct. In this figure the number of new molecules is half the number before the reaction.
|
|
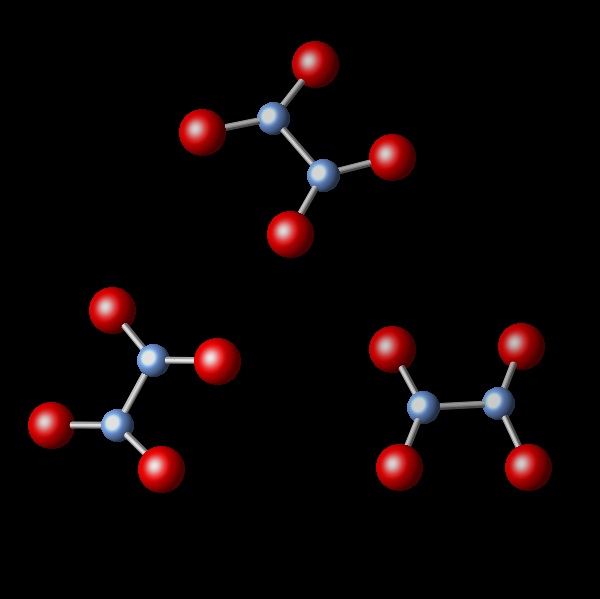
Wrong. This figure shows the same number of molecules as in the initial sample. This can not produce a change in volume.
|
|
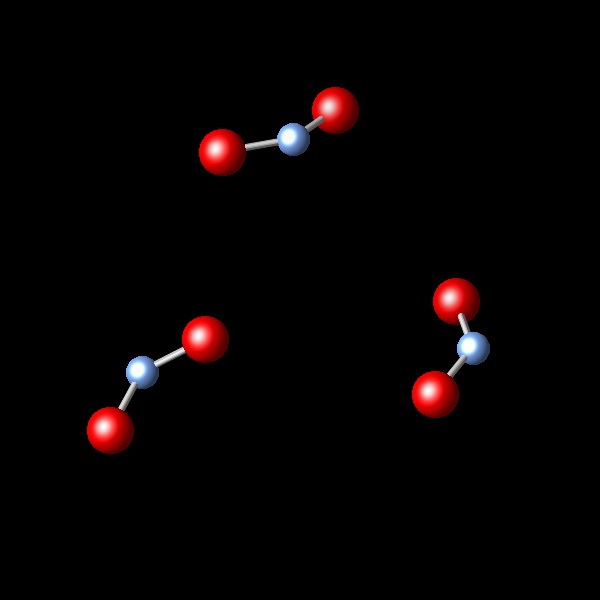
Wrong. This figure shows 1/3 of the molecules that were in the initial sample. This results in lower volume to 1/3 of the initial volume.
|
![]()
![]()