We discuss two very closely related techniques:
- Z-Scores : Z-Scores are a conversion (transformation) of individual scores into a standard form, where the transformation is based on knowledge about the population's mean and standard deviation.
- T-Scores : T-Scores (or standardized scores) are a conversion (transformation) of raw individual scores into a standard form, where the conversion is made without knowledge of the population's mean and standard deviation.
The formula for computing z-scores is:

Since we don't know the population's parameters, we estimate them by using our best guess: Their corresponding sample statistics. This means the formula for computing standard scores is:

T-Scores are not discussed in the book at this point, but we will need the idea later on.
We discuss these two statistical methods in this lecture.
If you wish, you can download a ViSta Applet to further pursue the analyses reported here (see instructions for configuring your system to do this).
- Definition:
- Z-Scores are a transformation of raw scores into a standard form, where the transformation is based on knowledge about the population's mean and standard deviation.
- Z-Score Formula:

- Try this interactive demo of Z-Scores to understand better how they are computed.
SAT Math Example
Consider the SAT-Math variable that we observed in the survey done on the first day of class.
|
Sample Statistics, Population Parameters and Sample Frequency Distribution for SAT Math |
|
|---|---|
| Statistics & Parameters | Sample Frequency Distribution |
|
Sample Statistics
Samp. Mean = 589.39 Samp. Stand. Dev. = 94.35 |
|
| Population Parameters
Pop. Mean = 460 Pop. Stand. Dev. = 100 |
|
Note that red is for males, blue for females.
- Your own SAT Math Z-Score
- You can compute your own SAT Math Z-Score by using the following formula:

Q: Why would you want to do this?
A: Because the standardized z-score value tells you several useful things:- The sign tells you whether your score is above or below the population mean.
- The number tells you the number of standard deviations your score is from (above or below) the population mean.
- When we get to the next chapter (see page 171) we will be able to easily convert the z-score into percentiles. (Preview: Z=0 is 50%; Z=1 is 84%; and Z=2 is 97%).
- Here is the frequency histogram for Math Z-Scores. Compare this with the original raw score frequency histogram shown below it. They are almost exactly the same.

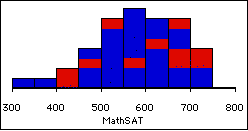
The Point: Transforming raw scores to Z-Scores doesn't change their distribution. But we can now tell that most of you (all but 4) are above the population mean.Looking at the summary statistics for the Z-Scores we see that: the mean of your scores is above the large majority of the general population of scores (since your mean is 1.29 and z=1 is at the 84% and z=2 is at the 97% --- we will see that z=1.29 is at the 90%).

- Here is another frequency histogram: This shows exactly the same Math Z-Scores as are in the preceeding histogram, but the two histograms look different.
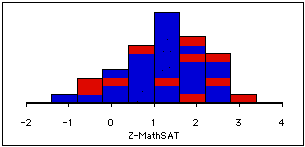
The Point: Histogram are not a very reliable (stable) visualization.
SAT Verbal Example
Consider the SAT-Verbal variable that we observed in the survey done on the first day of class.
|
Sample Statistics, Population Parameters and Sample Frequency Distribution for SAT Verbal |
|
|---|---|
| Statistics & Parameters | Sample Frequency Distribution |
|
Sample Statistics
Samp. Mean = 551.34 Samp. Stand. Dev. = 64.74 |
|
| Population Parameters
Pop. Mean = 430 Pop. Stand. Dev. = 100 |
|
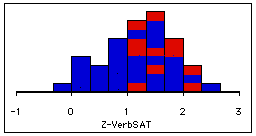
Again, red is for males, blue for females. Note that there are no males in the lower portion of the distribution!
- Definition:
- T-Scores are a transformation of raw scores into a standard form, where the transformation is made when there is no knowledge of the population's mean and standard deviation.
The scores are computed by using the sample's mean and standard deviation, which is our best estimate of the population's mean and standard deviation.
- T-Score Formula:

- Example:
- We must compute T-Scores for GPA, rather than Z-Scores, because we don't know what the population mean and standard deviation are for GPA.
This means we must estimate the population parameters by using the sample's mean and standard deviation. These are, respectively, 3.06 and .44, as shown in the summary report given earlier.
Thus, you can calculate your standardized GPA T-Score as

You can view the histogram for the entire distribution of GPA T-Scores. It should look like: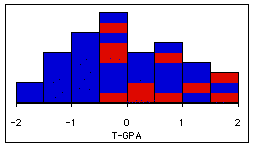
Note once again: There are no males in the lower range of GPA scores! - Compare GPA and SAT Verbal scores.
- Finally, we have now converted both GPA and SAT scores to standard scores, and we can compare them to each other easily. For example, we can form a scatterplot of one variable versus the other. This gives:
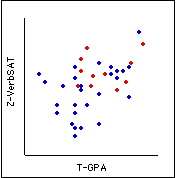
We see that there is some relationship between these two sets of scores: People who have higher Verbal SAT scores also have higher GPA's, and conversely. Also, we see that males are absent in the lower ranges of these two variables.
