This situation is probably the most common experimental design in Psychology. These designs are sometimes called between-subjects or between-groups designs.
Once again, the generic formula for the T-Statistic is:
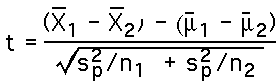
For the Independent Samples T-Statistic:
- Sample statistic : For Independent samples the sample statistic is the difference between the two sample means.
- Population Parameter : The population parameter is the hypothesized difference between the two population means.
- Estimated Standard error : The estimated standard error is defined as:
- Independent Samples T-Statistic : Finally we can see how the T-Statistic for independent samples is defined:
- Hypothesis Testing : Hypotheses are constructed just as before, except that they are about the differences (usually involving hypotheses about zero differences). There can be one-tail tests, but usually, tests are two-tailed.
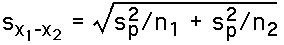
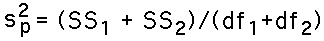
This formula for the estimated standard error uses the "pooled" (combined) errors for the two sample means. The formula for this is:
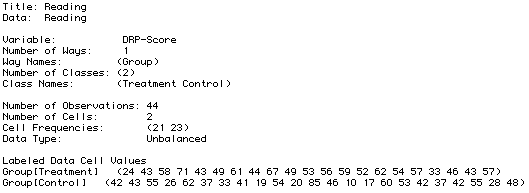
Dependent Samples T-Test Example: Reading Ability
We use data concerning reading ability. (These data are from page 543 of Moore and McCabe.) The data come from a study in which an educator tested whether a new directed reading activity help elementary school pupils improve their reading ability. The two groups are a classroom of 21 students who got the activity (the "Treatment" group), and another classroom of 23 students who didn't (the "Control" group). All students were given the Degree of Reading Power test.
The data report for the ViSta Data is:
|
The ViSta Applet for these data yields the following workmap:
|
We analyze these data using a one-tailed test based on a directional hypothesis that the directed reading activity will improve reading ability scores (that the "Treatment" group will have higher scores than the "Control" group).
Report-Model: The analysis of these data produces the following model report:
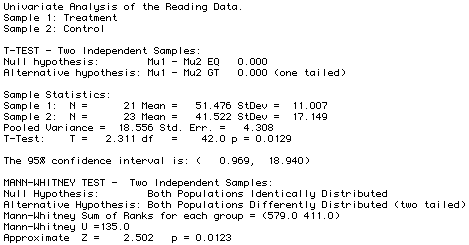 |
From this report we observe that p=.0129. Thus, we conclude that we can reject the null hypothesis that the reading activity did not improve reading ability scores. We also conclude that the reading activity had a "significant statistical effect" on the reading ability scores.
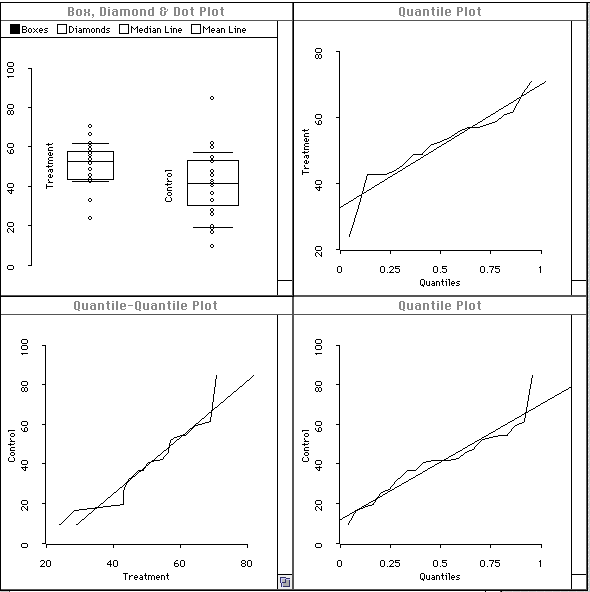
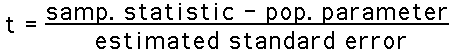
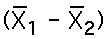
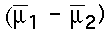
Visualize-Model: As pointed out in the chapter, the significance test requires that the data come from populations that are normally distributed with equal variance. The visualization helps us see whether these assumptions are met.
Normality: Interpreting features of these plots discussed above, we conclude that the data are reasonably normal.
Equal Variance: The box-plot, however, reveals that there may be more variation in the control group than in the treatment group (the box for the control group is taller than for the treatment group, and the observation dots cover a wider range for the control group). This may mean that the value of p (.0129) may be too optimistic. We note that we have one outlying control group value. Perhaps we should remove it and reanalyze the data.