One-Way ANOVA
(Independent-Measures)
-
-
Example:
- This is hypothetical data from an experiment examining
learning performance under three temperature conditions.
There are three separate samples, with n=5 in each sample.
These samples are from three different populations of
learning under the three different temperatures. The dependent
variable is the number of problems solved correctly.
Independent Variable:
Temperature (Farenheit) |
Treatment 1
50-F |
Treatment 2
70-F |
Treatment 3
90-F |
0
1
3
1
0 |
4
3
6
3
4 |
1
2
2
0
0 |
| Mean=1 |
Mean=4 |
Mean=1 |
|
This is a one-way, independent-measures design. It
is called "one-way" ("single-factor") because "Temperature"
is the only one independent (classification) variable.
It is called "independent-measures" because the measures
that form the data (the observed values on the number
of problems solved correctly) are all independent of
each other --- they are obtained from seperate subjects.
-
Hypotheses:
- In ANOVA we wish to determine whether the classification
(independent) variable affects what we observe on the
response (dependent) variable. In the example, we wish
to determine whether Temperature affects Learning.
In statistical terms, we want to decide between two
hypotheses: the null hypothesis (Ho), which says there
is no effect, and the alternative hypothesis (H1) which
says that there is an effect.
In symbols:
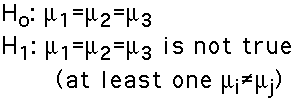
Note that this is a non-directional test. There
is no equivalent to the directional (one-tailed) T-Test.
-
The t test statistic for two-groups:
- Recall the generic formula for the T-Test:
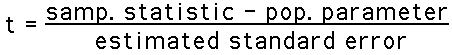
For two groups the sample statistic is the difference
between the two sample means, and in the two-tail test
the population parameter is zero. So, the generic formula
for the two-group, two-tailed t-test can be stated as:
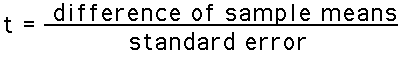
(We usually refer to the estimated standard error as,
simply, the standard error).
-
The F test statistic for ANOVA:
- The F test statistic is used for ANOVA. It is very similar
to the two-group, two-tailed T-test. The F-ratio
has the following structure:
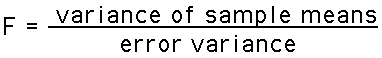
Note that the F-ratio is based on variance rather than
difference.
But variance is difference: It is the average
of the differences of a set of values from their mean.
The F-ratio uses variance because ANOVA can
have many samples of data, not just two as in T-Tests.
Using the variance lets us look at the differences that
exist between all of the many samples.
- The numerator: The numerator (top) of the F-ratio
uses the variance between the sample means. If the sample
means are all clustered close to each other (small differences),
then their variance will be small. If they are spread
out over a wider range (bigger differences) their variance
will be larger. So the variance of the sample means
measures the differences between the sample means.
- The denominator: The denominator (bottom) of
the F-ratio uses the error variance, which is the estimate
of the variance expected by chance. The error variance
is just the square of the standard error. Thus, rather
than using the standard deviation of the error, we use
the variance of the error. We do this so that the denominator
is in the same units as the numerator.
|
