Principal Components:
BiPlots
Forrest Young's Notes
Copyright © 1999 by Forrest W. Young.
A Biplot is an enhanced scatterplot that uses both points and vectors to represent structure. An example is shown below. This example is discussed in more detail here.
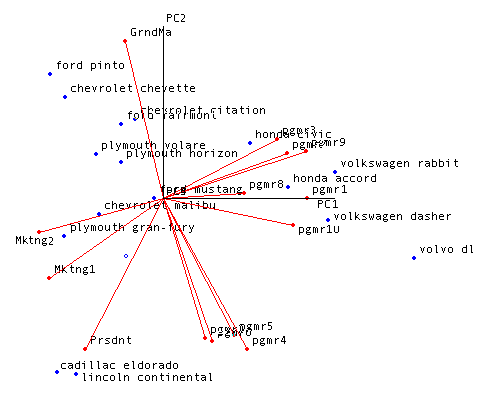
As used in Principal Component Analysis, the axes of a biplot are a pair of principal components. These axes are drawn in black and are labled PC1, PC2, etc.
A biplot uses points to represent the scores of the observations on the principal components, and it uses vectors to represent the coefficients of the variables on the principal components. In this example, the points represent automobiles, and the vectors represents judges.
Interpreting Points: The relative location of the points can be interpreted. Points that are close together correspond to observations that have similar scores on the components displayed in the plot. To the extent that these components fit the data well, the points also correspond to observations that have similar values on the variables.
In this example, cars that are close together are ones that have similar profiles of preference judgements: Most judges have the same kind of preference ratings for Cadillac and Lincoln Whether or not they like them we don't know, its just that is a judge likes one s/he tends to like the other, and if a judge dislikes one, then the othe is likely to be disliked. The same is true for Pinto and Chevette, although the judgments about Pinto and Chevette are likely to be rather different then those about Cadillac and Lincoln, since the two pairs of points are relatively far apart.
Interpreting Vectors: Both the direction and length of the vectors can be interpreted. Vectors point away from the origin in some direction.
A vector points in the direction which is most like the variable represented by the vector. This is the direction which has the highest squared multiple correlation with the principal components. The length of the vector is proportional to the squared multiple correlation between the fitted values for the variable and the variable itself.
The fitted values for a variable are the result of projecting the points in the space orthogonally onto the variable's vector (to do this, you must imagine extending the vector in both directions). The observations whose points project furthest in the direction in which the vector points are the observations that have the most of whatever the variable measures. Those points that project at the other end have the least. Those projecting in the middle have an average ammount. then the
Thus, vectors that point in the same direction correspond to variables that have similar response profiles, and can be interpreted as having similar meaning in the context set by the data.
So, for these data, where the vectors represent judges, and the points cars, a group of vectors pointing in the same direction correspond to a group of judges who have the same preference opinions about the automobiles. Thus, the judges whose vectors point towards 2 o'clock all have the same general likes and dislikes: What they like are imported cars and what they dislike are domestic cars. Note that these judges are all programmers. In contrast, the group of judges represented by the vectors pointing towards 5 o'clock (again, all programmers) like expensive cars, whether they are imported or domestic. Rather different is the one judge whose vector points towards 7 o'clock, the the two who point towards 8/9 o'clock. The first judge (who is the president of the company!) only likes expensive domestic cars, whereas the other two judges (who are in the marketing section of the company) like the "muscle cars". Finally, we have "GrandMa", who like the inexpensive cars!