(2)
A PDF atlas showing 5800 one-degree fields up to 12.5
magnitude
(3)
A PDF with the basic data and maps for the 11000 best Deep
Sky Objects by constellations
(4)
Plots for predicting the visibility of deep sky objects and
find the optimal detection magnification
(5)
Some software tools: making deep sky maps and prediction of
visibility of DSO
All
the programs, graphics and maps are free, offered to you with an altruistic intention. Enjoy them, and
clear skies.
 The TriAtlas is a major reference, that
includes 25, 90 and 661 charts (A, B and C sets), showing the night sky in a
detail level larger than the Millennium Sky Atlas. The core of the project is
the C-maps set:
The TriAtlas is a major reference, that
includes 25, 90 and 661 charts (A, B and C sets), showing the night sky in a
detail level larger than the Millennium Sky Atlas. The core of the project is
the C-maps set:
·
·
● It consists of 661
charts 10.5º x 8º in
PDF files
·
● 1º = 2.5 cm (quite good scale; do not shrink the
charts to print them!!)
·
● It shows stars up to 12.6 magnitude, quite good for the map scale,
preserving a constant value in the whole atlas
·
● It shows galaxies up to 15.5 magnitude from PGC (unlabelled from mag. 15 to
avoid cluttering), so there are around 37,000 galaxies plotted.
·
● It includes the revised
version of NGC and IC
(from the NGC/IC project), removing discarded objects
·
● ...1200 planetary nebulae
·
● ...1800 open clusters, and all globular
clusters
·
● ...SH-2, RCW and other catalogues for bright nebulae (no LBN because of
cluttering and repetitions): 900 objects
·
● ...LDN / Barnard (1850 dark nebulae)
·
● ...Double stars whose main star is
brighter than 11th magnitude (35,000 double stars)
·
● ...Variable stars whose maximum reaches
the 12.5 magnitude (29,000 variable stars)
·
● ...There are some
quasars (a few hundreds up to
16.5 mag), the stronger radiosources
and a selection of
galaxy clusters (all Hickson's and some Abell's)
·
● Double stars are labeled with a double
magnitude/distance code. For instance 1C indicates a disproportion in
magnitudes between main and secondary stars of 1.0 to 1.9 magnitudes, and C:
1.5 to 5 arcsec separation (A=<0.5", B=0.5-1.5",
C=1.5"-5", D=5"-15", E=15-60", F=>60").
The
B-maps set is a standard-alone atlas, that
reaches 11 mag with a linear scale similar to Sky Atlas 2000 but a detail level
similar to Uranometria, although with more stars. This set together with the A-maps (the project index) constitute a perfect handy atlas
to use in the field. The A maps are the index to B and C maps and show a
selection of the best deep sky objects. It is a good reference for beginners or
to plan a quick session with bright and easy objects.
This new project has a separated page in
this website, owing to its large entity. To get the charts (it is free
atlas!!!), follow this link.
 Everybody knows that for catching faint
deep sky objects, one has to know exactly where to look at. We need a detailed
star atlas to succeed, showing very faint stars. Imagine for a moment an atlas
reaching the 12.5 magnitude. It would plot millions of stars and would include
thousands of charts filling several volumes. Too bulky to carry with us, isn't
it? However, what we really need to know in detail is only the neighbourhood of the deep sky object we are looking for.
Why charting then with high detail "empty" areas which we are not
really interested in? Think in how we do starhopping. First we use our finder,
and with the only assistance of our favourite sky atlas (Herald-Bobroff, Sky
Atlas 2000) we gradually move to the area. Then we look through the telescope
to enlarge the area, look back again to our atlas, and... ops... our atlas does
not plot anything of what we can see in the eyepiece field.
Everybody knows that for catching faint
deep sky objects, one has to know exactly where to look at. We need a detailed
star atlas to succeed, showing very faint stars. Imagine for a moment an atlas
reaching the 12.5 magnitude. It would plot millions of stars and would include
thousands of charts filling several volumes. Too bulky to carry with us, isn't
it? However, what we really need to know in detail is only the neighbourhood of the deep sky object we are looking for.
Why charting then with high detail "empty" areas which we are not
really interested in? Think in how we do starhopping. First we use our finder,
and with the only assistance of our favourite sky atlas (Herald-Bobroff, Sky
Atlas 2000) we gradually move to the area. Then we look through the telescope
to enlarge the area, look back again to our atlas, and... ops... our atlas does
not plot anything of what we can see in the eyepiece field.
I
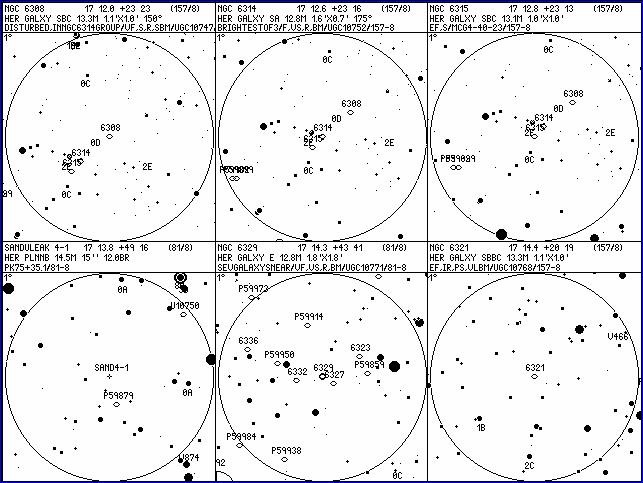
present here a special deep sky atlas. It is a free 10 Mb pdf document to be used as a complement of your favourite deep sky atlas. It consists of 120 A4 pages that must be printed at least at 600 dpi, otherwise the resolution will be
insufficient to display the bitmaps. It consists of 108 map pages with 54 one‑degree fields to 12.5 magnitude by page. Each mini-map is centred in a
particular deep sky object, and shows some information at the top. The 54
fields within any of these pages are gathered in blocks of six maps each: the
picture below shows one of these blocks in detail. The charts are sorted by constellation,
then by right ascension and if required, by declination. In the last pages of
the document you will find also an index that allows an easy location, listing
the basic data and the respective Sky
Atlas 2000 and Uranometria 2000 charts. These mini‑maps were generated
with an old program that I created some years ago (for the updated software,
follow this link), and in spite of
being draft (unrefined), I think that are extremely useful for field work.
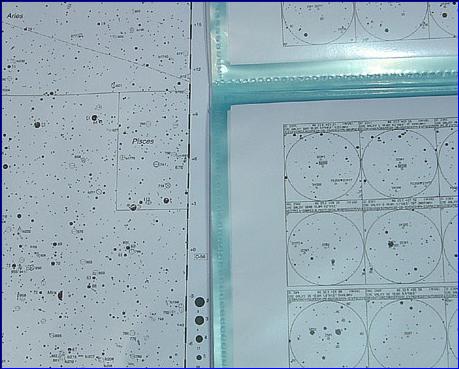
As
mentioned, I recommend printing the atlas at 600 dpi with a laser printer and
storing the pages in a folder with plastic sheets as you see above. The
collection was designed to fill a 60 pages folder (both faces: there are 108
charts with maps and 12 index pages):
For
each object, the index entry indicates first the page number (1-108), then the
block number (1-9), and then the location within the block (1-6). The order is
1=1st row 1st column, 2=1st row 2nd column, etc. The index in the PDF document
is printed with very small fonts. If you want the index in a text document to
elaborate at your will, grab these files:
Miguel
Arizu, from
I
have prepared a second atlas with another 5800 objects fainter than these and
some galaxy clusters filling a second folder, and also two progressive atlases
that do not require the use of a main general atlas since include views similar
to Sky Atlas 2000 and Uranometria. If I get space, I will link them.
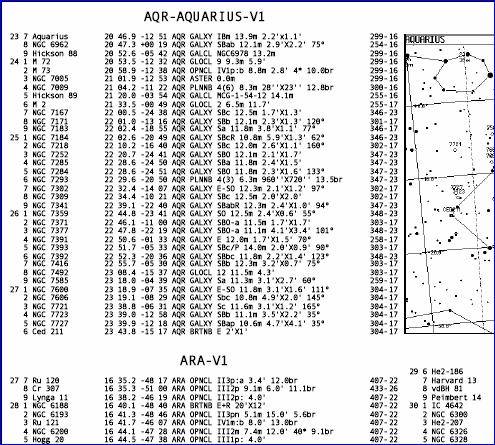 It is also a rather practical tool: a 40
pages PDF file listing the basic data for the best 11000 Deep Sky Objects by
constellations. The provided information is: name, right ascension and
declination (2000.0), constellation code, object type, other information
(object class, magnitude, size, number of stars/position angle/brightest or
central stars, etc), and Uranometria (1st. ed.) and Sky Atlas 2000 chart.
Each constellation also includes a small map (sometimes with zoomed areas)
plotting the objects .
It is also a rather practical tool: a 40
pages PDF file listing the basic data for the best 11000 Deep Sky Objects by
constellations. The provided information is: name, right ascension and
declination (2000.0), constellation code, object type, other information
(object class, magnitude, size, number of stars/position angle/brightest or
central stars, etc), and Uranometria (1st. ed.) and Sky Atlas 2000 chart.
Each constellation also includes a small map (sometimes with zoomed areas)
plotting the objects .
On
the right you can see a fragment showing the Aquarius area. Do you want the
file? Then...
Download the master constellation
atlas/list
I
hope you will like it, and more important, it results to be a worth tool to
assist you in your deep sky sessions.
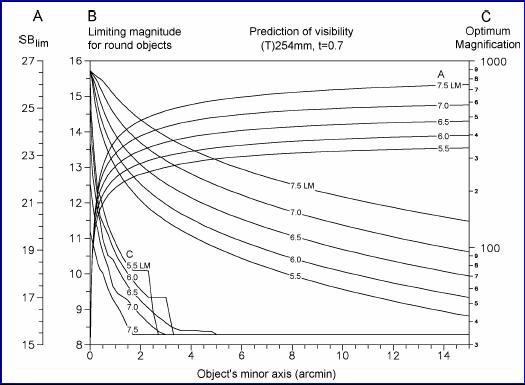 And here you will find another very
useful tool. It is a set of graphics for several telescopes that can be used to
predict the visibility of deep sky objects at several naked-eye limiting
magnitude (LM, from 5.5 to 7.5).
And here you will find another very
useful tool. It is a set of graphics for several telescopes that can be used to
predict the visibility of deep sky objects at several naked-eye limiting
magnitude (LM, from 5.5 to 7.5).
Download the PDF file with graphics
The
considered telescopes are the most usual:
Refractors (R): 68, 80, 90 and 102 mm
Reflectors (T): 127, 152, 203, 254, 305, 356, 406 and
457 mm
There
are three plots overlaid. First, two of them develop two independent strategies
that can be applied to predict the visibility, depending on the information we
have:
Strategy A It is for elliptical/irregular objects
(lines and axes labeled as "A" in the sample plot). We have to input
the size of the object minor axis in arcmin (X axis), and the object surface
brightness (SBlim) in mag·arcsec-2 (Y axis). If the
object is below the line
corresponding to the current naked-eye limiting magnitude, then it will be
visible provided we adjust properly the magnification at the telescope.
Strategy B It is for more or less circular objects
(lines and axes labeled as "B" in the sample plot). The use is
straightforward since we just need to input the size of the object axis in
arcmin (X axis) and the object visual magnitude (Y axis). Again, if the object
is below the line corresponding to
the current naked-eye limiting magnitude, then the object will be visible
provided we adjust properly the magnification.
Optimal detection
magnification The axes and lines labeled as "C" to the right allow finding the optimal detection magnification. We have to find the value
corresponding to the object minor axis in arcmin in the X axis, and go then
vertically from that point up to cross the curve corresponding to the current
naked-eye limiting magnitude. Then go to the right and you will read the
optimal detection magnification in the axis.
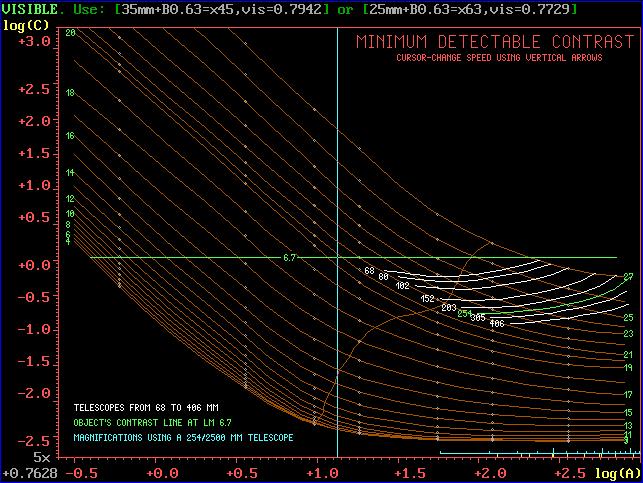
These
strategies are based on a modification of the Roger Clark's method, but make
direct use of the Blackwell's curves. If you want to know the fundamentals in
detail, then grab this PDF article, or
visit this this web page.
NOTE: SBlim is defined as follows:
SBlim = mag + 8.89 +
2.5·log (a·b*PI/4), where mag is the object visual magnitude, a and b the object major and minor axes in arcmin, PI is the constant 3.1416, and log indicates decimal logarithm.
This
section has separate entries in the website. Basically, you will find two tools
(1) PREDICTION OF VISIBILITY SOFTWARE
I
have placed here a small MSDOS utility to predict the visibility of both
stellar and non stellar objects, applying directly the Blackwell's data on a
modification of the Clark's theory to solve its limitations for small objects.
The propossed prediction system (the "Threshold method") works very
well for objects of any kind (bright, faint, large or small), in dark, twilight
or even in daylight conditions (planets). It is thoroughly explained in this PDF article, or in this this webpage. The plots
for making predictions without calculations are also based on that theory. Just
unzip the file TELE.EXE in any folder, and run it. The first time you run it,
you will see a couple of information screens (an introduction and a glossary)
before displaying the main screen. The next times you will go straightforwardly
to the main screen, where you will be able to apply three different prediction
systems: (1) the original Roger N. Clark method (the "Clark method"), (2) a second method for stellar
sources (the "Stellar method"), and a third one: the
modification of the Clark method before mentioned (the "Threshold method").
Download the prediction of visibility program
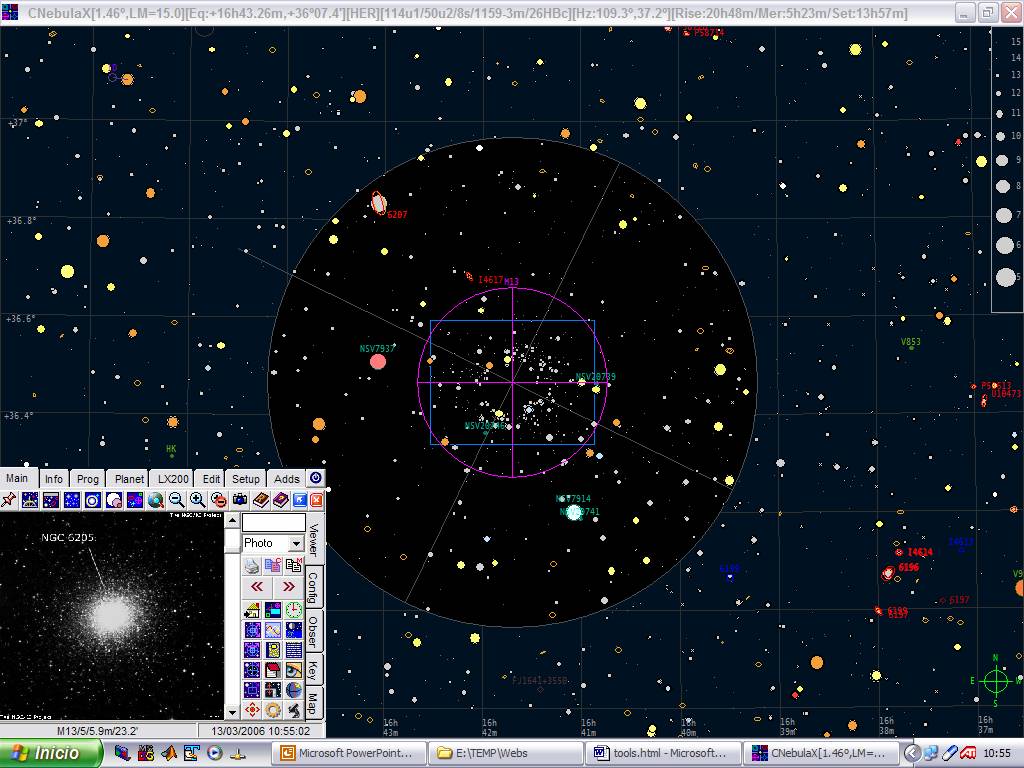
(2) MAPPING SOFTWARE: The CNebulaX project
This
software is my more complex deep sky project. It can plot 25 million stars and
more than a million deep sky objects. It is freeware and available to download,
offered to everybody with my best will for free. Owing to its magnitude, it has
separated pages (as the TriAtlas Project). To go there and get the files
(freeware), follow this link.