Guided Interactive Applet
for Spearman Correlation
- First, get the data.
- Then, convert it to ranks.
- Finally, compute correlations.
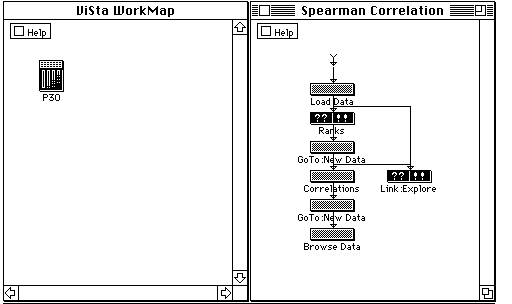
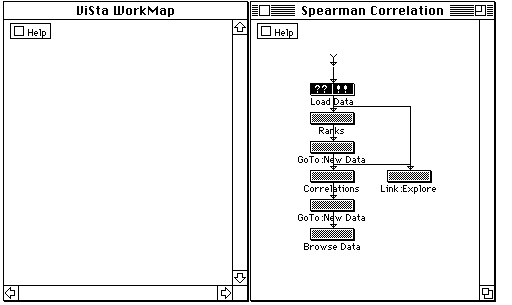
- Data have been loaded
After clicking on a guidemap button the workmap changes to show the data analysis step that just took place, and the guidemap changes to show the next step(s) the student is guided to take.
In this example the workmap shows that data named P30 have been loaded into ViSta, and the guidemap shows that the next steps are to either Explore the data or to compute Ranks.
The student chooses to explore the raw data, and the windows change as shown next.
- Exploring the data.
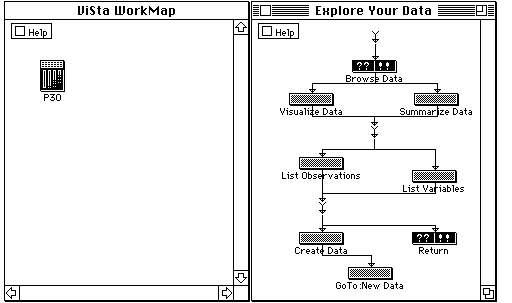
The Explore Your Data guidemap presents the basic steps in exploring data: browse the dataset, visualize the data, look at summary statistics, and notice what the variable and observation names are. We don't go into these details here.
After completing the steps in the Explore Your Data guidemap, guidance returns to the Spearman Correlation guidemap. It is still guiding the student to compute ranks, as shown above in step 2. After doing this the guidemap changes to guide the student to compute correlations on the ranked data, as shown below.
- After ranks are computed
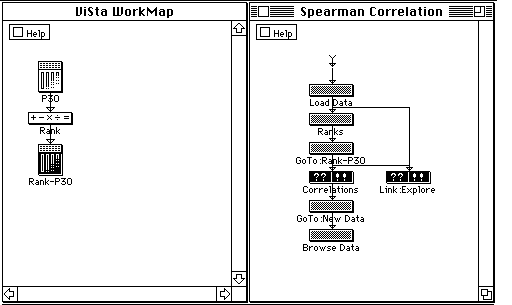
Notice that the workmap shows that a new dataset, called Rank-P30 has been computed as a result of passing the original P30 data through the Rank process. Notice also that the guidemap is guiding the student to either explore the ranked data or to compute correlations.
- The Spearman Correlations
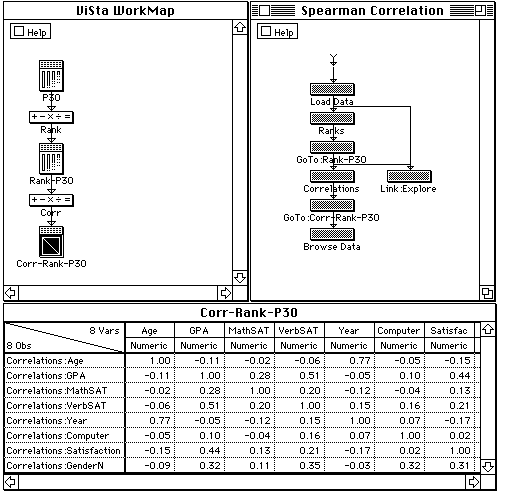
Finally, the student computes correlations from the ranks and uses the Browse button to look at them.
Back Copyright © 1998 by Forrest W. Young.
All rights reserved.
The first figure is what the student sees after downloading the guided applet.
The student sees two of ViSta's windows, the WorkMap window (which is empty) and the GuideMap window (called "Spearman Correlation"). The workmap is empty at first because no data analysis steps have taken place.
The Spearman Correlation guidemap shows the steps to compute a spearman correlation:
To begin, the student reads the help information and determines that s/he must click on a highlighted button. Since the only highlighted button is the Load Data button, the student is guided to begin by loading in some data.
The windows now change as shown next.