Bar mode instabilities
(see Chapter 10)
|
|
||
| Model D1 | [top] |
|
 |
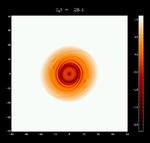
Low T/|W| bar mode instabilities
in model D1. Matter density normalised to maximum density (color
coded). The left panel shows the evolution for the low resolution model
(D1L), and the right panel for the high resolution model (D1H). |
|
 |
Vorticity, i.e. rotational of the velocity (color coded). The left panel shows the evolution for the low resolution model (D1L), and the right panel for the high resolution model (D1H). | |
 |
Specific angular momentum (color coded). The left panel shows the evolution for the low resolution model (D1L), and the right panel for the high resolution model (D1H). | |
 |
Schlieren plot, i.e. gradient of logarithm of density (color coded). The left panel shows the evolution for the low resolution model (D1L), and the right panel for the high resolution model (D1H). | |
| Model D2 | [top] | |
 |
Low T/|W| bar mode instabilities in model D2. Matter density normalised to maximum density (color coded). The left panel shows the evolution for the low resolution model (D2L), and the right panel for the high resolution model (D2H). | |
 |
Vorticity, i.e. rotational of the velocity (color coded). The left panel shows the evolution for the low resolution model (D2L), and the right panel for the high resolution model (D2H). | |
 |
Specific angular momentum (color coded). The left panel shows the evolution for the low resolution model (D2L), and the right panel for the high resolution model (D2H). | |
 |
Schlieren plot, i.e. gradient of logarithm of density (color coded). The left panel shows the evolution for the low resolution model (D2L), and the right panel for the high resolution model (D2H). | |
| Model D3 | [top] | |
 |
Low T/|W| bar mode instabilities in model D3. Matter density normalised to maximum density (color coded). The left panel shows the evolution for the low resolution model (D3L), and the right panel for the high resolution model (D3H). | |
 |
Vorticity, i.e. rotational of the velocity (color coded). The left panel shows the evolution for the low resolution model (D3L), and the right panel for the high resolution model (D3H). | |
 |
Specific angular momentum (color coded). The left panel shows the evolution for the low resolution model (D3L), and the right panel for the high resolution model (D3H). | |
 |
Schlieren plot, i.e. gradient of logarithm of density (color coded). The left panel shows the evolution for the low resolution model (D3L), and the right panel for the high resolution model (D3H). | |