Magnetized core collapse
(see Chapter 10)
| Model A1B3G3-D3M0 | [top] |
|
 |
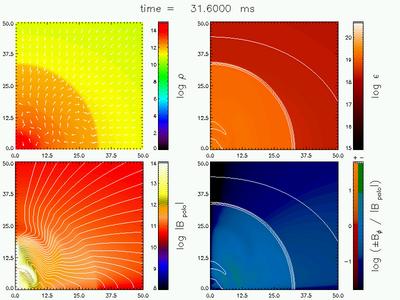
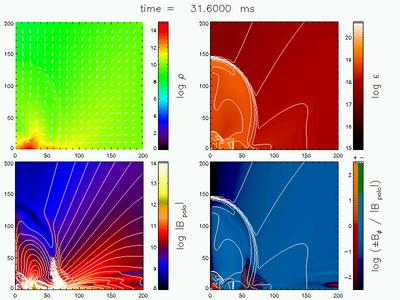
Magnetized collapse model
A1B3G3-D3M0. The upper left panel shows the logarithm of the density,
in g cm-3 (color coded), and the distribution of the
velocity field (white arrows). The upper right panel shows the
logarithm of the specific internal energy, in c.g.s. units (color coded
and contours). The lower left panel shows the logarithm of the poloidal
component of the magnetic field, in G (color coded), and the magnetic
field lines in the meridional plane (lines). The lower right
panel shows log(Btoroidal/|Bpoloidal|)
(color coded), and the logarithm of the specific internal
energy (contours). All axes are given in km. |
|
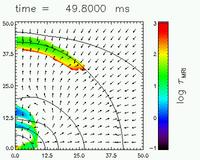 |
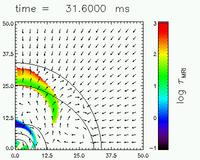
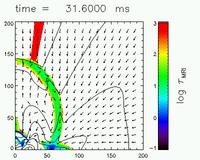
Magneto-rotational instability
(MRI) in model A1B3G3-D3M0. Color coded is the logarithm of the
time-scale of the fastest growing mode, in ms. Depicted in white are
the regions where the MRI condition is not fulfilled or the time-scale
is larger than 1 s. Arrows indicate the velocity field, and the
contours the rest mass density. All axes are in km. |
|
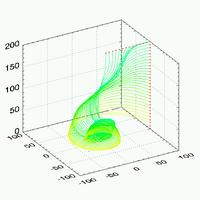 |
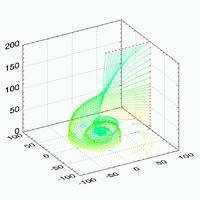
Magnetic field lines for model
A1B3G3-D3M0. The box represents the region above the equatorial plane,
and the axes are in km. Colors are proportional to the magnetic flux of
each line. |
|
|
|
||
| Model A1B3G5-D3M0 | [top] | |
 |
Magnetized collapse model A1B3G5-D3M0. The upper left panel shows the logarithm of the density, in g cm-3 (color coded), and the distribution of the velocity field (white arrows). The upper right panel shows the logarithm of the specific internal energy, in c.g.s. units (color coded and contours). The lower left panel shows the logarithm of the poloidal component of the magnetic field, in G (color coded), and the magnetic field lines in the meridionalplane (lines). The lower right panel shows log (Btoroidal/|Bpoloidal|) (color coded), and the logarithm of the specific internal energy (contours). All axes are given in km. | |
 |
Magneto-rotational instability (MRI) in model A1B3G5-D3M0. Color coded is the logarithm of the time-scale of the fastest growing mode, in ms. Depicted in white are the regions where the MRI condition is not fulfilled or the time-scale is larger than 1 s. Arrows indicate the velocity field, and the contours the rest mass density. All axes are in km. | |
 |
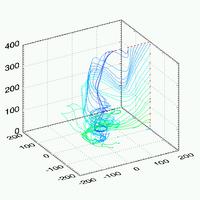
Magnetic field lines for model A1B3G5-D3M0. The box represents the region above the equatorial plane, and the axes are in km. Colors are proportional to the magnetic flux of each line. | |
| Model A4B5G5-D3M0 |
[top] | |
 |
Magnetized collapse model A4B5G5-D3M0. The upper left panel shows the logarithm of the density, in g cm-3 (color coded), and the distribution of the velocity field (white arrows). The upper right panel shows the logarithm of the specific internal energy, in c.g.s. units (color coded and contours). The lower left panel shows the logarithm of the poloidal component of the magnetic field, in G (color coded), and the magnetic field lines in the meridionalplane (lines). The lower right panel shows log (Btoroidal/|Bpoloidal|) (color coded), and the logarithm of the specific internal energy (contours). All axes are given in km. | |
 |
Magneto-rotational instability (MRI) in model A4B5G5-D3M0. Color coded is the logarithm of the time-scale of the fastest growing mode, in ms. Depicted in white are the regions where the MRI condition is not fulfilled or the time-scale is larger than 1 s. Arrows indicate the velocity field, and the contours the rest mass density. All axes are in km. | |
 |
Magnetic field lines for model A1B3G3-D3M0. The box represents the region above the equatorial plane, and the axes are in km. Colors are proportional to the magnetic flux of each line. | |
| Model A1B3G3-T3M0 | [top] | |
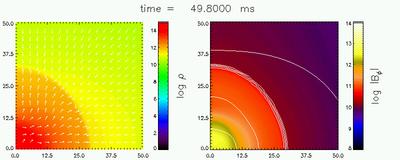 |
Magnetized collapse model A1B3G3-T3M0. The left panel shows the logarithm of the density, in g cm-3 (color coded), and the distribution of the velocity field (white arrows). The right panel shows the Logarithm of the toroidal magnetic field, in G. All axes are in km. | |
| Model A1B3G5-T3M0 | [top] | |
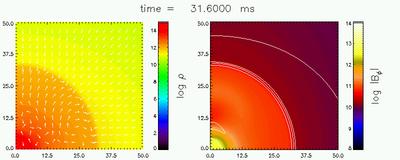 |
Magnetized collapse model A1B3G5-T3M0. The left panel shows the logarithm of the density, in g cm-3 (color coded), and the distribution of the velocity field (white arrows). The right panel shows the Logarithm of the toroidal magnetic field, in G. All axes are in km. | |
end