CLASSICAL
CONFIDENCE INTERVALS FOR TEMPORAL RANGES
Strauss and Sadler (1989) derived a one-tailed confidence interval
for a taxon's stratigraphic or temporal range that we shall use
here:
p1
= 1 - (1 + a)-(n - 1) (1)
where p1 is the
confidence level (e.g., 0.95), their a is the range extension expressed as a
proportion of the known stratigraphic or temporal range (not to
be confused with conventional use of a to represent level of significance, see
below), and n is the number of independently-sampled
fossiliferous horizons. Solving for a by rearranging terms yields the required
range extension as a function of the confidence level and number
of samples (Marshall 1990). Derivation of equation 1 by Strauss and
Sadler and discussion of this by Marshall both make it seem
unduly complicated (due in part to the complexity of their
notation), but the derivation is actually both simple and
intuitive, as we discovered by deriving this independently (Gingerich and Uhen 1994).
Start by assuming that fossils are
uniformly distributed throughout the unknown estimated temporal
range or expected temporal density [ETD] of a taxon of
interest (Fig. 1).
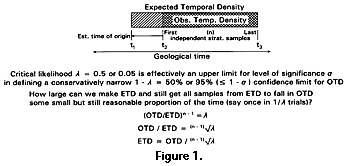 This assumption of uniformity is too
simplistic, and we will relax it later (when the density
associated with an area or volume need no longer correspond to
the temporal range). Assume that sampling is random. A uniform
ETD means that fossils from different times have an equal
probability of being sampled. Construct a sample of some size n
by drawing n independent samples at random from ETD. We
can now sort these from oldest to youngest and they define the
observed temporal range or observed temporal density
[OTD]. We are interested in the time of origin of Archaeoceti and
do not care about their time of extinction (or conversion into
Odontoceti and Mysticeti), meaning that we are interested in a
one-tailed range extinction. This is, in any case, more
conservative (yielding a broader interval) in allocating all of
the tail probability to one tail. One sample is required to
define the youngest end of the OTD (t3, the
time we are not interested in here), so n - 1 samples
remain for estimation of ETD and t1 from OTD
and t2.
This assumption of uniformity is too
simplistic, and we will relax it later (when the density
associated with an area or volume need no longer correspond to
the temporal range). Assume that sampling is random. A uniform
ETD means that fossils from different times have an equal
probability of being sampled. Construct a sample of some size n
by drawing n independent samples at random from ETD. We
can now sort these from oldest to youngest and they define the
observed temporal range or observed temporal density
[OTD]. We are interested in the time of origin of Archaeoceti and
do not care about their time of extinction (or conversion into
Odontoceti and Mysticeti), meaning that we are interested in a
one-tailed range extinction. This is, in any case, more
conservative (yielding a broader interval) in allocating all of
the tail probability to one tail. One sample is required to
define the youngest end of the OTD (t3, the
time we are not interested in here), so n - 1 samples
remain for estimation of ETD and t1 from OTD
and t2.
We require one additional number a, the level of
significance or error rate we are willing to accept. This
determines the confidence interval 1 - a that we seek. By convention, a = 0.05 is the
usual error rate, which corresponds to a 95% confidence interval
for observed temporal density OTD.
The probability that any sample
drawn from unknown ETD falls in OTD is the ratio of lengths (or
areas or volumes) OTD/ETD, which cannot be greater than 1
(because ETD is greater than or equal to OTD). If the probability
that one sample drawn from ETD falls in OTD is OTD/ETD, then the
probability that two samples drawn independently from ETD both
fall in OTD is the product of OTD/ETD times OTD/ETD or (OTD/ETD)2.
The probability that n - 1 samples drawn from
ETD all fall in OTD is (OTD/ETD)n-1. Setting
this quantity equal to the error rate a:
a = (OTD/ETD)n-1 (2)
which is, in simpler form, exactly
the same as equation 1 [where p1 =
1 - a and (1 + a)-(n-1) = (OTD/OTD +
(ETD-OTD)/OTD)-(n-1) = (OTD/ETD)n-1].
Solving for ETD yields:
ETD = OTD / a1/(n-1)
= OTD / (n-1)Öa (3)
With a = 0.05 and an observed range OTD based on
two independent samples, meaning n - 1 = 1,
the 95% confidence limit for ETD is 20 × OTD. When OTD is based
on three independent samples, meaning n - 1 =
2, the 95% confidence limit for ETD is 4.47 × OTD. ETD/OTD is
the inverse of the (n - 1)th root of a. This quantity
converges rapidly to 1 as n increases, meaning ETD
approximates OTD even for relatively small n. Further,
this result is not very sensitive to a.
If we assume that the distribution
of fossils representing the temporal duration of a group of
organisms is uniform through time, and if we know (1) the
beginning and end of the group's stratigraphic or observed
temporal range (t2 and t3,
respectively, in Fig. 1), and (2) the number of independent
samples this range is based on (n), then we can estimate
the time of origin of the group (t1 in Fig.
1). The beginning and end of the observed range encompass the
observed temporal density OTD. OTD is necessarily represented by n
is greater than or equal to 2 samples. Estimated temporal range
ETD can be calculated using equation 3, and the difference
between ETD and OTD is added to the beginning of the observed
temporal density. This yields a classical 1 - a confidence
limit for the time of origin of the group.