WATER-COLUMN VS. SEDIMENTS COMPARISONS (Figures 259-275)
 Comparison of specific occurrences of selected species in water column and sediment samples (Figure 259) Comparison of specific occurrences of selected species in water column and sediment samples (Figure 259)
All water-column (N: 3562) and sediment (N: 3157) samples were used for this graph. The figure for each species is the average latitude (absolute values) of all the samples where the species was present. Because the mean latitude of sedimentary samples is 1.32 times that of all plankton samples, their index was divided by this figure. The graph is restricted to the 100 most abundant species.
Comparison of the occurrences of selected species in water column and sediment samples (Figure 260)
T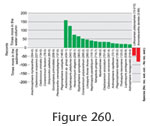 his graph illustrates the most important differences in the numbers of times a given species was recorded in the water-column vs. the number of times it was recorded in the sediments. Species selected are those that had at least 70 records in the water column or sediments and occurred at least 16 times more frequently in one of the two types of materials than in the other. Numbers in parentheses after each species name denote numbers of samples where it was recorded in water column materials (first figure) and in sedimentary materials (second figure). For columns graphed, the total number of occurrrences in the water column and in the sediments were corrected for total number of water column and sediment samples in the database. his graph illustrates the most important differences in the numbers of times a given species was recorded in the water-column vs. the number of times it was recorded in the sediments. Species selected are those that had at least 70 records in the water column or sediments and occurred at least 16 times more frequently in one of the two types of materials than in the other. Numbers in parentheses after each species name denote numbers of samples where it was recorded in water column materials (first figure) and in sedimentary materials (second figure). For columns graphed, the total number of occurrrences in the water column and in the sediments were corrected for total number of water column and sediment samples in the database.
 Comparison of mean species percentages in the water-column and the sediments (data averaged for 5x5 degree Marsden squares) (Figure 261,
Figure 262) Comparison of mean species percentages in the water-column and the sediments (data averaged for 5x5 degree Marsden squares) (Figure 261,
Figure 262)
 All available percentage data were pooled in 5 x 5 degree Marsden squares and averaged for water column (plankton and sediment traps) and sedimentary materials separately. For those Marsden squares where data for both the water-column and the sediments were available mean proportions in the sediments were substracted from the mean proportions in the water-column. N values indicate total numbers of original data points involved in each comparison. Graphs are restricted to species where a strong bias toward one of the sources is apparent. All available percentage data were pooled in 5 x 5 degree Marsden squares and averaged for water column (plankton and sediment traps) and sedimentary materials separately. For those Marsden squares where data for both the water-column and the sediments were available mean proportions in the sediments were substracted from the mean proportions in the water-column. N values indicate total numbers of original data points involved in each comparison. Graphs are restricted to species where a strong bias toward one of the sources is apparent.
|