Anomalies
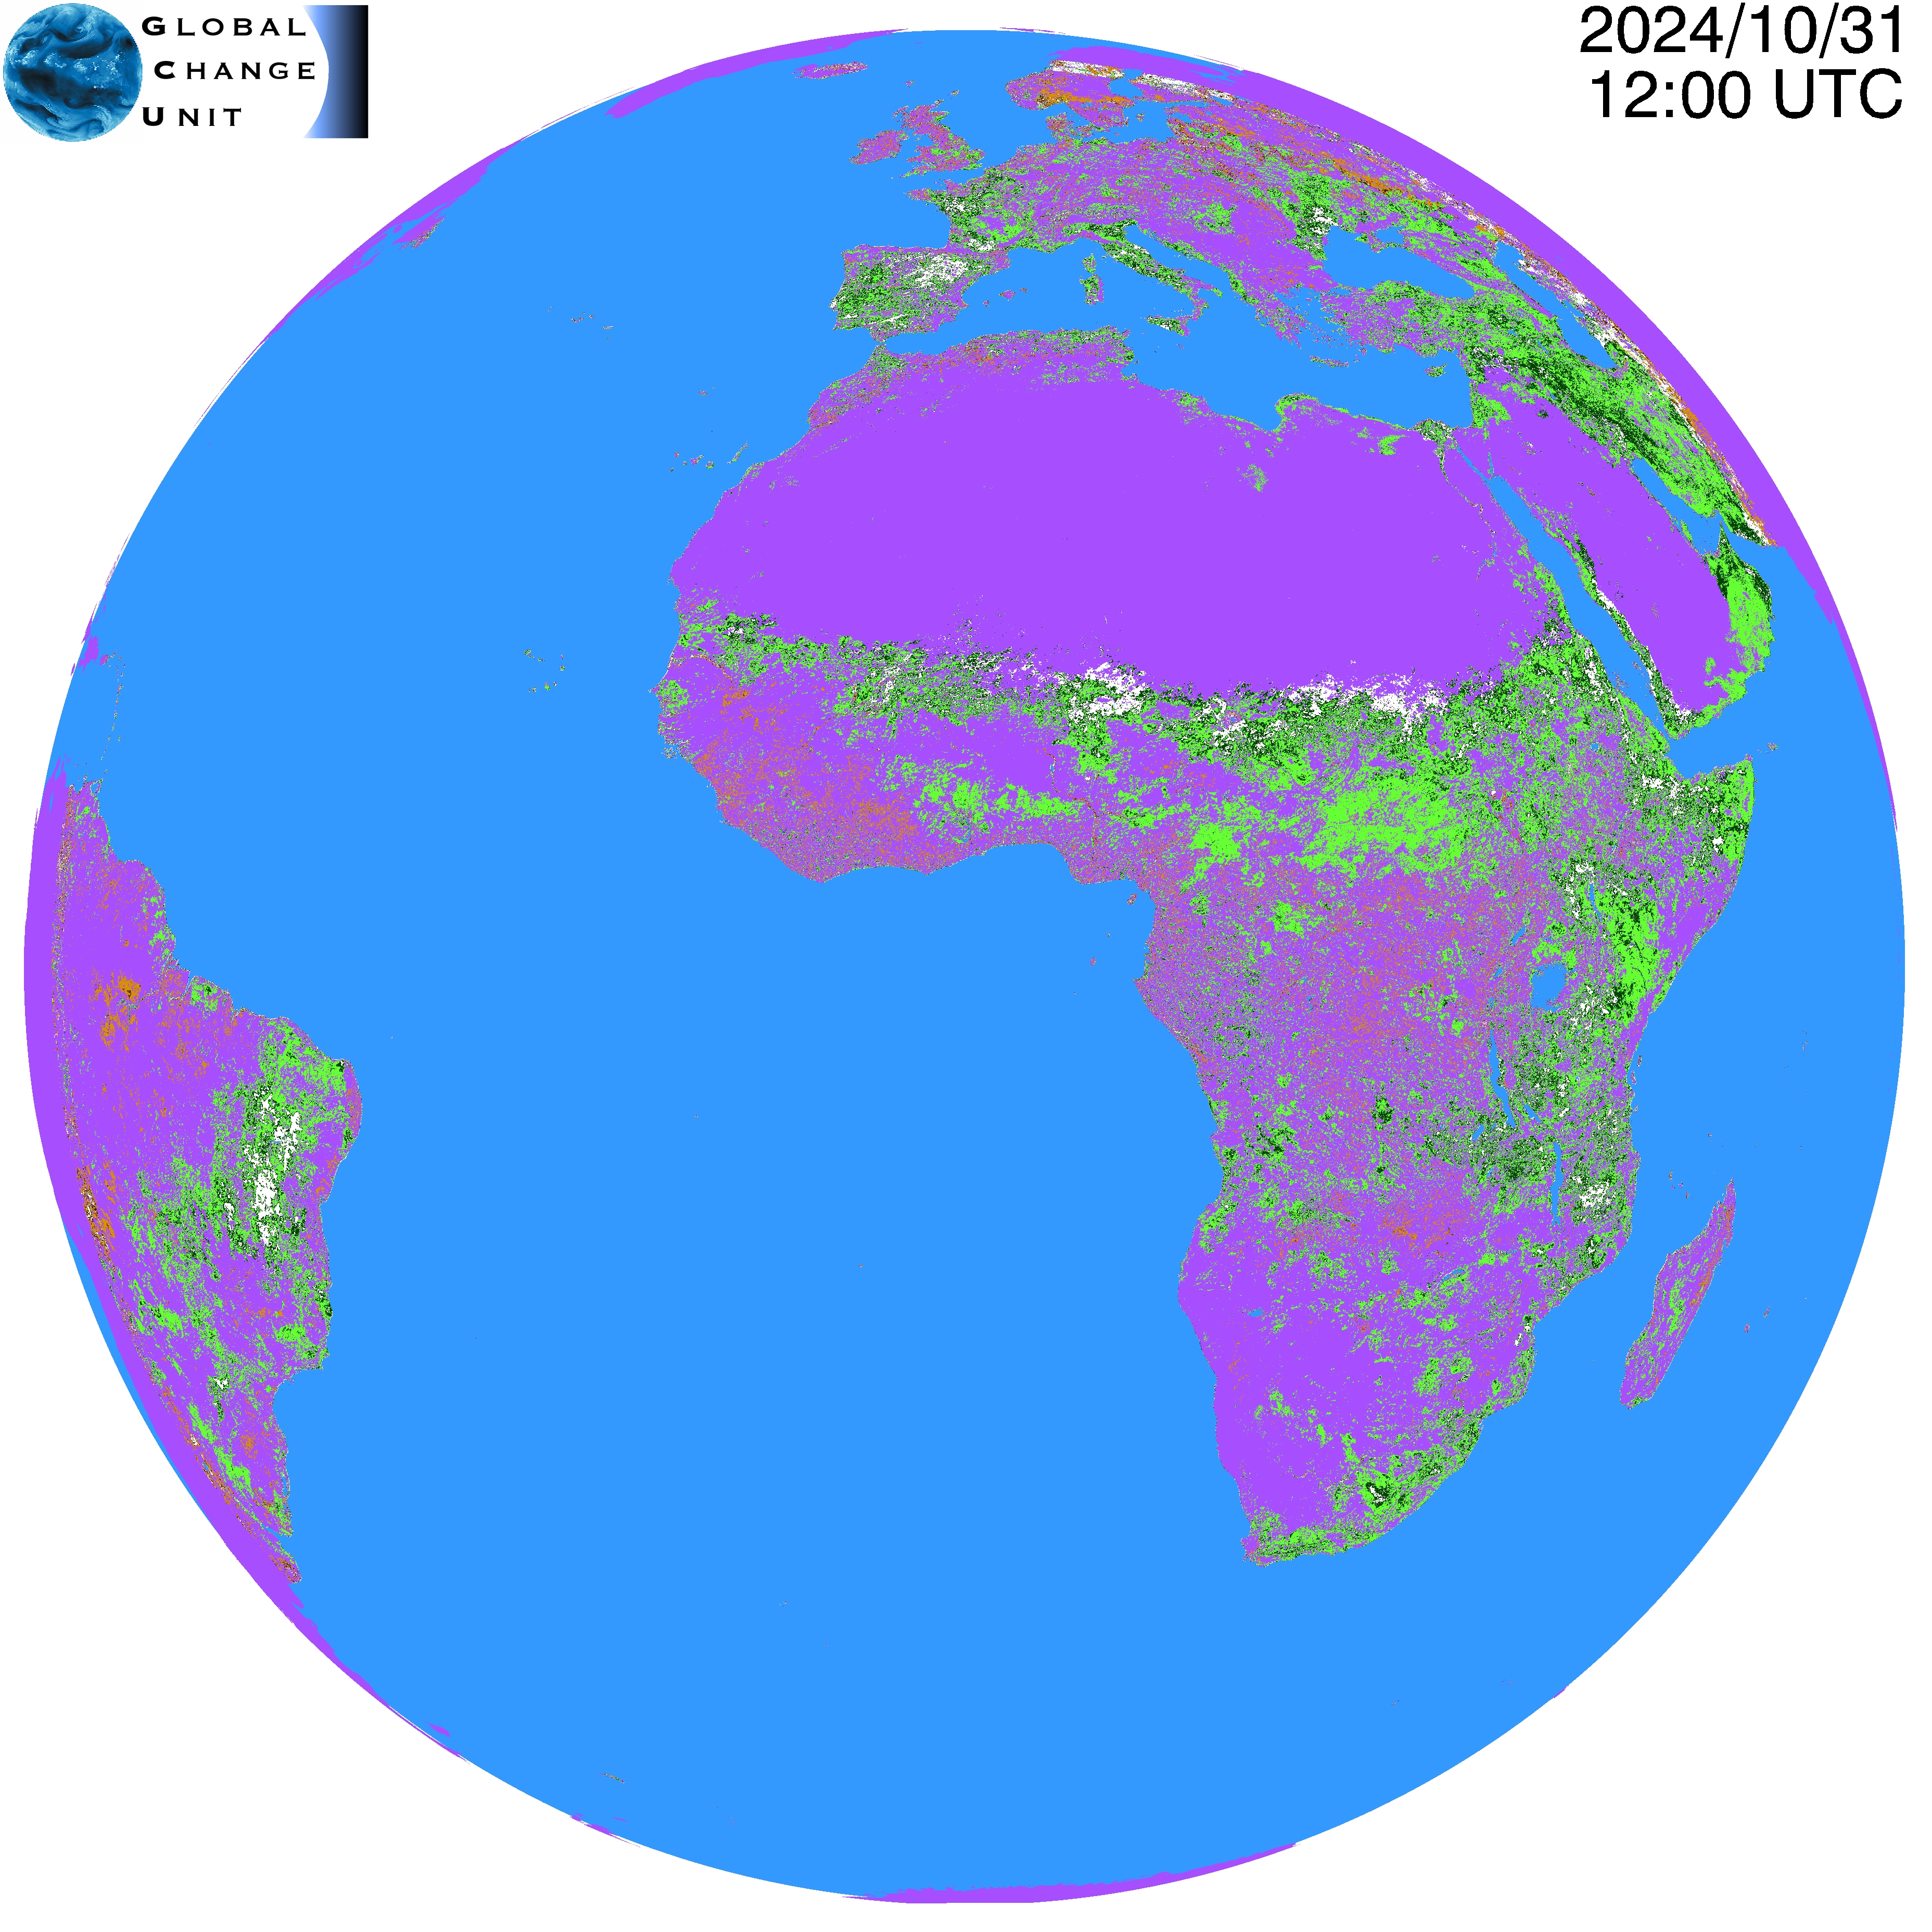

This map shows the anomaly (difference) between the NDVI (vegetation greenness) for most recent cloud-free observations and the NDVI average values for the current month over the period 2007-2016. Green colors correspond to a greener vegetation than usual, and brown to a less green vegetation that during the period 2007-2016.
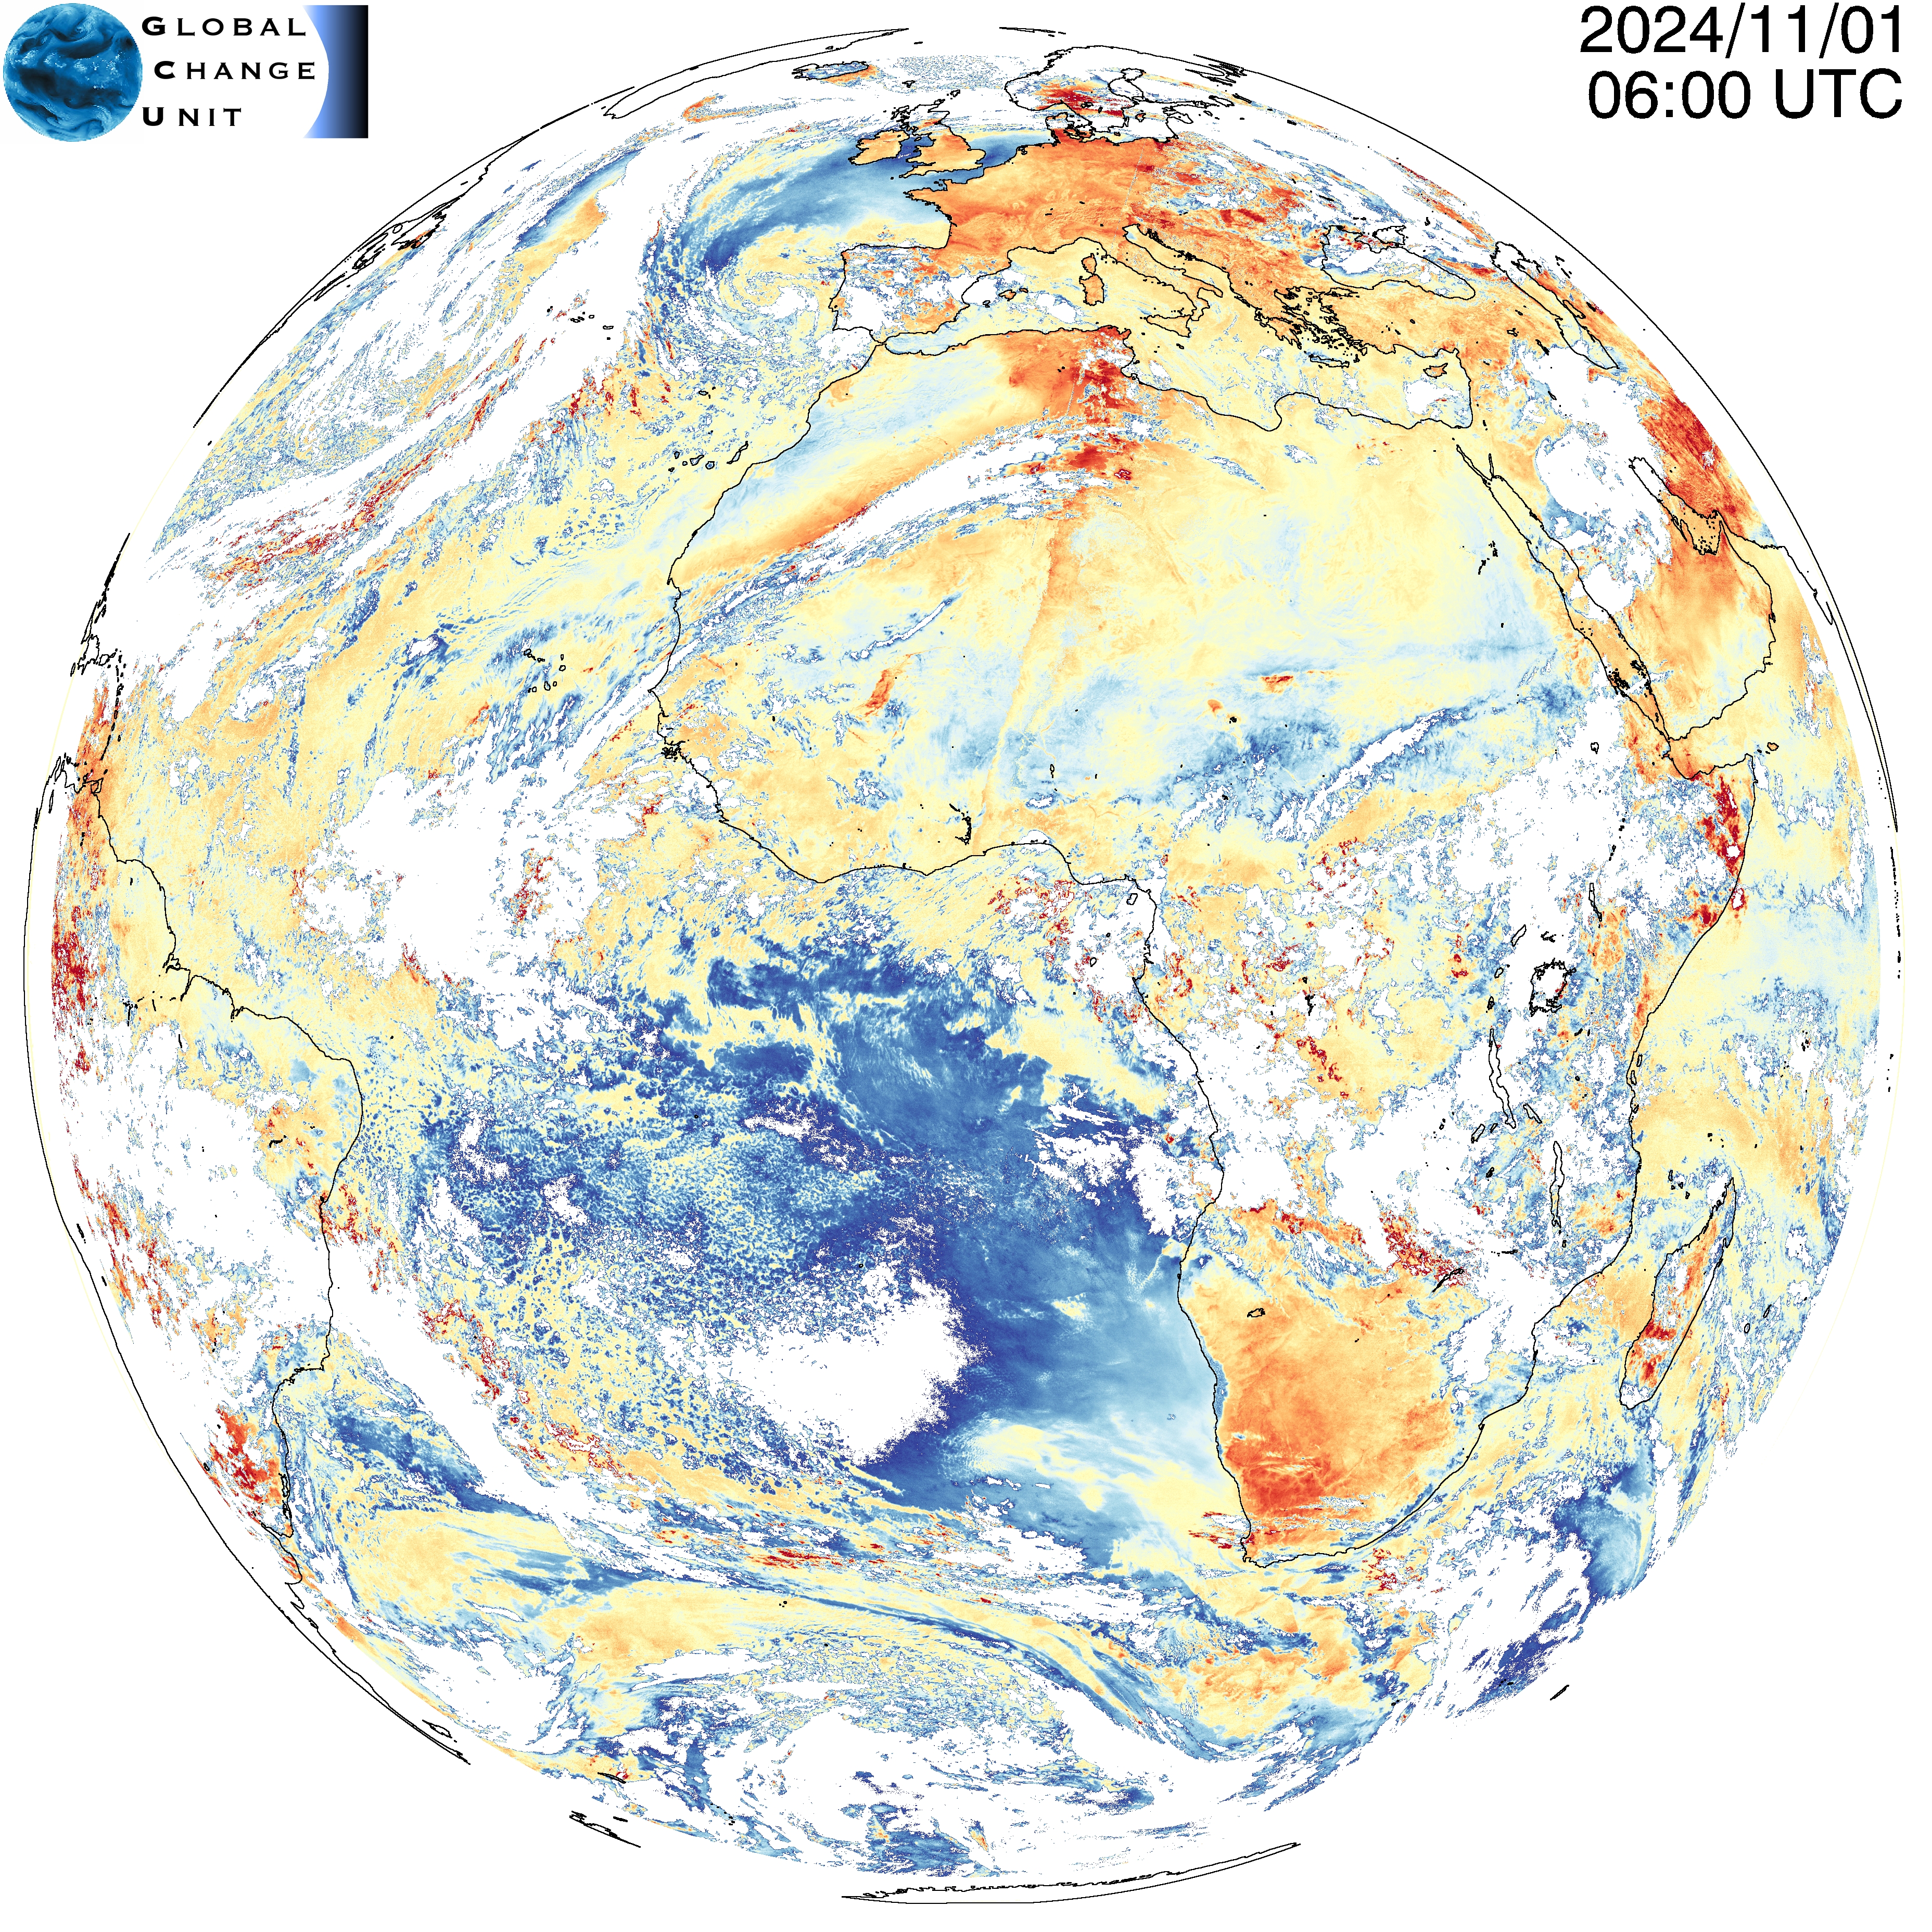
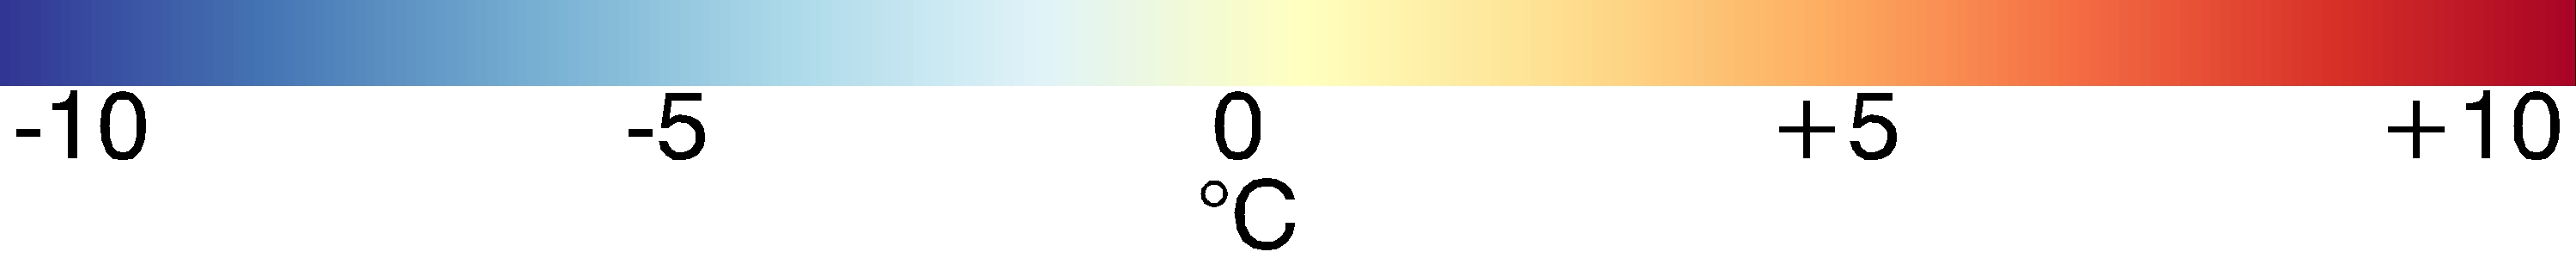
This map shows the anomaly (difference) between the actual surface temperature and the average temperatures at this same moment over the period 2010-2019. Hotter red, cooler in blue, and clouds in white.
All the specifics of the applied methodology are described here.