©A. Oteo
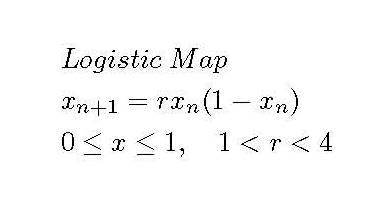
| LogMap is an acronym for Logistic Map. |
| LogMap is an interactive program that allows a thorough visual illustration of the regular and chaotic features of the Logistic map: trajectories (including sensitivity to initial conditions), Lyapunov exponent, bifurcation diagram, invariant density and cobweb diagram. |
| As the logistic map is a paradigm for teaching Chaos, the program is a tool that allows a hands on approach to a large number of issues on Chaos and Non-Lineal Dynamics. |
| In
this page we provide the code, a description
of its features and a tutorial. |
| Code: |
| Freeware software under GPL license. |
| Operating systems: Win98/98SE/2000/XP/2003/Vista/7. |
| Developers: J.M.
Castelo, J.A.
Oteo. |
| Languages:
Spanish|English. |
| The
code has been written by J.M. Castelo in
C++, and uses OpenGL Library routines
(graphics) and wxWidgets (graphical user
interface). |
| LogMap v.1.5.6
download |
| Disclaimer: This program is
freeware. If you decide to use it, you do so
entirely AT YOUR OWN RISK. The authors do not
provide support but are always interested in your
comments and suggestions. |
| Documentation: |
| Program
description and instructions handbook in
pdf format. Manual de instrucciones y descripción del programa en formato pdf. |
| A copy of the
Master Thesis by J.M. Castelo (in spanish) about
the code and its use, with pedagogical purposes,
in pdf format. |
| This is a pdf
version of the tutorial.
Authors: J.M. Castelo, J.A. Oteo and J. Ros. It is intended as a list of suggestions to be developed at the classroom. |
| Screenshots |
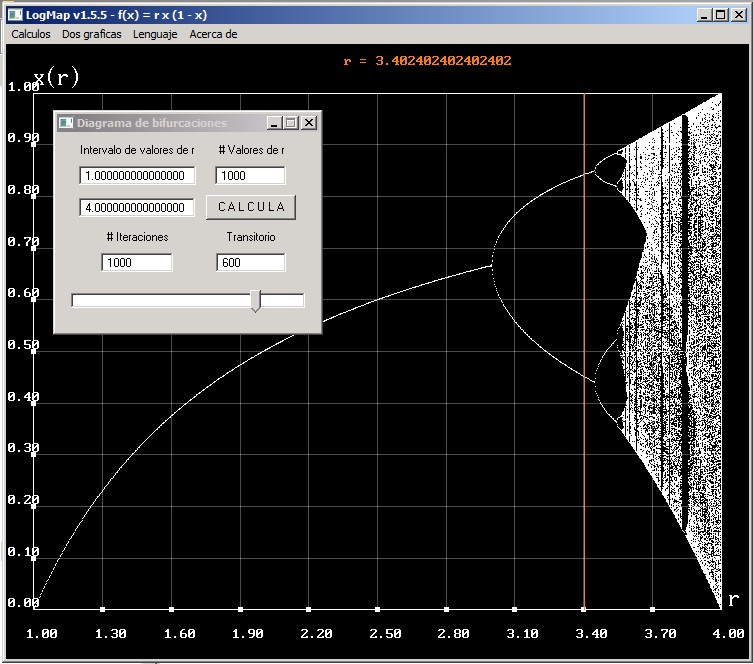 |
| Bifurcation diagram: Asymptotic values of x as a function of the parameter r. |
 |
| Bifurcation
diagram and Lyapunov exponent as a function of r. |