THE METHOD
Casting
Most laser-confocal microscopes can
detect reflective as well as excited fluorescent light.
Therefore, in principle, original teeth can be used for confocal
imaging in the reflective mode. However, we were able to use
original teeth in only certain cases and therefore developed a
casting method to enable the detection of fluorescent light. We
made epoxy resin casts (Translux D 180, Axon) with eosin (Eosin
blue, Merck) as dye. Eosin is a common histological dye and
highly fluorescent (excitation 525 nm, emission 545 nm). For
casting, 100g resin, 45g hardener with accelerator (2 drops), and
0.5 ml of eosin solution were used (see Errata
Note 16 March
1999). The eosin solution was prepared by dissolving eosin in 70%
EtOH solution overnight. The next day any undissolved dye was
removed using filter-paper. An eosin concentration of 1% in
ethanol gave workable fluorescence, but a saturated solution
(1mg/10ml) was found to work better in fast confocal imaging. A
stronger eosin concentration makes the casts darker, but still
translucent enough for inspection and removal of bubbles. The
epoxy was poured into the molds with the help of a small syringe
or brush, and air bubbles were removed manually. Casts were left
to set for two days.
Confocal Microscopy
 In confocal microscopy only reflected light
that is in the focal plane is detected (Figure
1). The widely-used
confocal microscopes in contemporary biomedical research depend
on a laser beam to scan the specimen. The use of laser light,
while preventing the acquisition of a continuous spectrum image,
allows the detection of narrow wave-length fluorescent light used
in the study of cell biology and biochemistry. The single laser
scanning beam can form two or more simultaneous images using
filters to detect different wavelengths. These confocal
microscopes have a motorized focus that allows accurate changes
in the focal plane and automated collection of optical sections
(Figure 1).
In confocal microscopy only reflected light
that is in the focal plane is detected (Figure
1). The widely-used
confocal microscopes in contemporary biomedical research depend
on a laser beam to scan the specimen. The use of laser light,
while preventing the acquisition of a continuous spectrum image,
allows the detection of narrow wave-length fluorescent light used
in the study of cell biology and biochemistry. The single laser
scanning beam can form two or more simultaneous images using
filters to detect different wavelengths. These confocal
microscopes have a motorized focus that allows accurate changes
in the focal plane and automated collection of optical sections
(Figure 1).
We used a Zeiss Axiovert 135M
microscope with the BioRad MRC-1024 confocal system and an
American Laser Corporation 60WL argon/krypton laser (maximum
output 100mW) located at the Institute of Biotechnology,
University of Helsinki. The confocal scanning is operated via
Lasersharp software package (BioRad). Teeth or casts were
attached with Blue-tack onto an objective slide and
oriented by eye to a desired plane. Care must be taken to insure
that lower aspects of the occlusal relief are not overshadowed by
higher features in order for the microscope to image the entire
occlusal surface. In general, we arranged the teeth so that the
tips of the main cusps fell on the same horizontal plane. We used
Zeiss Plan-neofluar objectives with magnifications 2.5x and 10x.
These lenses have working distances of 9.3 mm and 5.6 mm,
respectively. The maximum scan-window areas, and hence maximum
specimen size that can be recorded using one optical sectioning,
are 12.8 x 10.2 mm and 3.2 x 2.5 mm respectively. Although lenses
with smaller magnifications would allow larger specimens to be
scanned, their lower light-gathering ability (= Numerical
Aperture) results in a weak laser signal. Therefore, larger teeth
were optically sectioned in several scan windows, which
overlapped adjacent windows. The overlapping areas of resulting
digital elevation models (DEMs) were used for alignment of
partial DEMs to make a complete DEM of a tooth.
For epoxy casts with eosin dye, the
laser power was usually set to 10% with normal scanning speed.
The laser beam was filtered with T1 (triple dichroic) and T2A
filter (560 DRLP filter that splits the light to red and green).
The green light was detected with a photomultiplier using
emission filter 522 DF 32 with low signal attenuation and gain
set to maximum (1500). The iris, which controls the degree of
confocality in the image, was set to 1.0-2.2, and black level was
varied between 0-12 (to adjust gray value for zero-signal). These
settings depend on several factors; particularly the
magnification used and concentration of dye. In general, if the
signal is too weak, the DEMs exhibit "black holes"
(areas with no signal) and appear grainy. To increase a weak
signal the scanning speed is set to slow, and the black level
setting used to adjust the image. If the signal is too strong the
individual scans are overexposed (with large areas becoming
saturated), and the DEMs lack detail. To decrease a strong
signal, we used the gain and black level settings. We found
settings for attaining good DEMs that proved quite robust (see
below), and the iris setting had no detectable effect on the DEMs
until very large settings (>3.0) were attempted, resulting in
the loss of confocality in individual scans.
For original specimens that are
scanned in the reflective mode, the laser power was set to 3%
with normal scanning speed. The laser beam was passed through a
B1 beam splitter and a T1 (triple dichroic) filter. The emission
filter was a blue reflection filter with normal signal
attenuation and gain set to between 1000 and 1500. The iris was
set to 0.7-2.0 and black level was between 0-18. In general, the
reflective mode gave a strong signal when we used Recent
specimens with clean enamel surfaces. Results with fossils were
variable depending on the degree of enamel coloration.
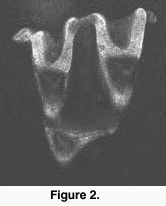 Each section was scanned three to six times,
and the images averaged (Kalman averaging). Scanned stacks were
saved as Biorad MRC 600-standard picture files (Figure
2). We found the use of
confocal scanning fast for teeth that can be scanned with one
window (up to 20 specimens/hour), but the need to scan large
teeth in several pieces considerably reduced the data acquisition
speed.
Each section was scanned three to six times,
and the images averaged (Kalman averaging). Scanned stacks were
saved as Biorad MRC 600-standard picture files (Figure
2). We found the use of
confocal scanning fast for teeth that can be scanned with one
window (up to 20 specimens/hour), but the need to scan large
teeth in several pieces considerably reduced the data acquisition
speed.
Digital Elevation Models
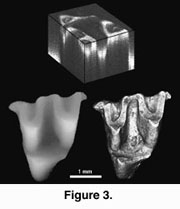 We used the 3Dview version (public domain by Iain Huxley) of National
Institute of Health (NIH) Image software to make high-resolution
digital elevation models (DEMs) from the image stacks (Figure
3). First, we imported an
image stack to 3Dview using Biorad MRC 600 import macro (Figures
2, 3). The 3Dview software uses an autofocus method (e.g., Hamilton and Wilson 1982) to construct the DEMs. The software
searches for the brightest section for each x-y coordinate point
and then fits a surface along the brightest points. A parabolic
fit was used to produce our DEMs. We tested the accuracy of the
DEMs by creating digital objects and sectioning them using the
NIH Image software. The DEMs were practically identical to the
digital objects when the sectioning interval was adequate (see
below, Figure 4). Software DEM calculation takes only a few
seconds with an Apple iMac-computer. Additionally, the 3Dview
calculates a maximum brightness image that shows the
surfaces’ fluorescence (or reflectance) and appears
reminiscent of a scanning electron micrograph (Figure 3). The
maximum brightness image is useful in illustrations (by combining
it with the DEM) and also for locating bubbles in the casts.
Additionally, a maximum brightness image can be used for
verifying that the signal is neither too strong (the image is
overexposed) nor too weak (the image has dark holes).
We used the 3Dview version (public domain by Iain Huxley) of National
Institute of Health (NIH) Image software to make high-resolution
digital elevation models (DEMs) from the image stacks (Figure
3). First, we imported an
image stack to 3Dview using Biorad MRC 600 import macro (Figures
2, 3). The 3Dview software uses an autofocus method (e.g., Hamilton and Wilson 1982) to construct the DEMs. The software
searches for the brightest section for each x-y coordinate point
and then fits a surface along the brightest points. A parabolic
fit was used to produce our DEMs. We tested the accuracy of the
DEMs by creating digital objects and sectioning them using the
NIH Image software. The DEMs were practically identical to the
digital objects when the sectioning interval was adequate (see
below, Figure 4). Software DEM calculation takes only a few
seconds with an Apple iMac-computer. Additionally, the 3Dview
calculates a maximum brightness image that shows the
surfaces’ fluorescence (or reflectance) and appears
reminiscent of a scanning electron micrograph (Figure 3). The
maximum brightness image is useful in illustrations (by combining
it with the DEM) and also for locating bubbles in the casts.
Additionally, a maximum brightness image can be used for
verifying that the signal is neither too strong (the image is
overexposed) nor too weak (the image has dark holes).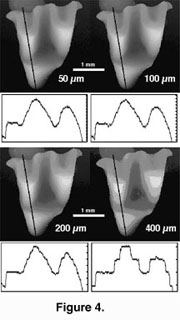
The quality of DEMs deteriorated
visibly when the images were scanned at 200 µm intervals (Figure
4). We collected optical sections at the intervals of 50 µm
except for very small teeth (< 1 mm) and larger teeth (> 6
mm) that were collected at intervals of 25 µm and 100 µm
respectively. Digital Elevation Models containing surface
irregularities (e.g., scratches) or noise (e.g., if the signal
was low) can be smoothed for analysis of large surface features
(e.g., slope angles).
It is worthwhile to note that while
the image stacks can be quite large (up to 20 MB), the
corresponding DEMs are small (typically under one MB). Thus, they
can be easily stored.
Visualization
 The DEMs are useful for illustrating tooth
shapes. Additionally, DEMs and maximum brightness images of a
tooth can be combined using graphics software (e.g., Adobe
Photoshop). However, DEMs are useful for analysis as their
greyscale values correspond to height differences. This height
information can be used to generate a three-dimensional
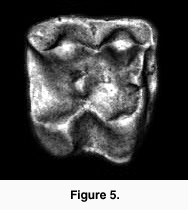
reconstruction of the tooth. For example, using the Callisto Photoshop plug-in (Mac OS shareware by Kas
Thomas) one can examine teeth from any angle. Moreover, Callisto
facilitates overlay of the maximum brightness image on the
rendered tooth, producing quite a realistic representation of
tooth shape (Figure 5). In addition, the DEM's greyscale can be
coded with false colors, aiding the examination of tooth topology
(Figure 6), a procedure that also makes it easier to
recognize landmarks for spatial measurement (or assigning DEMs to
robust tooth shape categories such as crown types, see Jernvall et al. 1996).
The DEMs are useful for illustrating tooth
shapes. Additionally, DEMs and maximum brightness images of a
tooth can be combined using graphics software (e.g., Adobe
Photoshop). However, DEMs are useful for analysis as their
greyscale values correspond to height differences. This height
information can be used to generate a three-dimensional
reconstruction of the tooth. For example, using the Callisto Photoshop plug-in (Mac OS shareware by Kas
Thomas) one can examine teeth from any angle. Moreover, Callisto
facilitates overlay of the maximum brightness image on the
rendered tooth, producing quite a realistic representation of
tooth shape (Figure 5). In addition, the DEM's greyscale can be
coded with false colors, aiding the examination of tooth topology
(Figure 6), a procedure that also makes it easier to
recognize landmarks for spatial measurement (or assigning DEMs to
robust tooth shape categories such as crown types, see Jernvall et al. 1996). 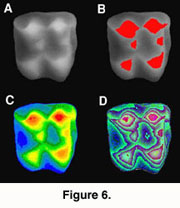
Data Analysis and Geographic
Information Systems
All traditional morphometric
measurements (e.g., lengths, widths, heights, and angles) can be
obtained from the DEMs. This can be done directly in NIH Image
(or in 3Dview). For calibration of the crown height, we used the
standard of a known height marked directly on the image stacks to
calculate the amount of height difference (in µm) that each gray
level value represented (i.e., two bright spots adjacent to each
other but on different sections so that their height difference
is 1 mm). It is useful to add blank sections to image stacks so
that all teeth under study have the same number of sections. This
enables one standard to be used to calibrate all the teeth.
Measurements can be obtained using NIH Image macros to create the
desired output files. For example, when gray level values are
calibrated to be equal to xy distances, the following NIH Image
macro gives the distance between two points in three dimensions:
macro 'Chord-distance [C]';
var
x1,x2,y1,y2,width:integer;
begin
SetUser1Label('Chord');
GetLine(x1,y1,x2,y2,width);
if x1<0 then begin
PutMessage('This macro requires a straight line selection.');
exit;
end;
Measure;
rUser1[rCount]:=sqrt(sqr(x1-x2)+sqr(y1-y2)+sqr(GetPixel(x1,y1)-GetPixel(x2,y2)));
UpdateResults;
end;
Alternatively, only the
xyz-coordinate locations can be recorded and used in calculations
performed by other software. However, since the DEMs represent
the "total shape data", they can be used to explore
tooth shapes prior to the selection of measurements for further
study. This is particularly important for small teeth, which may
be quite difficult to examine in reflected light.
 A recent approach to the analysis of tooth
DEMs is to consider them analogous to geographical data (Reed 1997, Hunter and Jernvall 1998, Zuccotti et al. 1998). This enables the use of GIS software that
often have powerful image analysis capabilities. Using
appropriate GIS software tooth DEMs can be rectified (oriented)
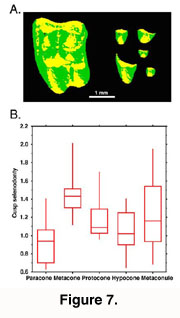
and various aspects of the tooth shape can be summarized. For
example, by quantifying the areas of longitudinal and transverse
slopes for each cusp, subtle differences in cusp selenodonty
(elongation) can be measured (Figure 7). This kind of analysis would be difficult
from landmark-based data because they would necessitate the
detection of several "fuzzy" landmarks (Valeri et al. 1998). Also, the use of GIS software allows
accurate measures of occlusal volumes to be made and subsequently
to address more functional aspects of tooth shape.
A recent approach to the analysis of tooth
DEMs is to consider them analogous to geographical data (Reed 1997, Hunter and Jernvall 1998, Zuccotti et al. 1998). This enables the use of GIS software that
often have powerful image analysis capabilities. Using
appropriate GIS software tooth DEMs can be rectified (oriented)
and various aspects of the tooth shape can be summarized. For
example, by quantifying the areas of longitudinal and transverse
slopes for each cusp, subtle differences in cusp selenodonty
(elongation) can be measured (Figure 7). This kind of analysis would be difficult
from landmark-based data because they would necessitate the
detection of several "fuzzy" landmarks (Valeri et al. 1998). Also, the use of GIS software allows
accurate measures of occlusal volumes to be made and subsequently
to address more functional aspects of tooth shape.