To carry out scientific studies with long temporary meteorological data series it's required to employ fiable measurements. That is the main point to use a Quality Control in the data base. Quality Control is a procedure to provide information about the kindness of the analyzed measurements.
Quality Control implanted in Valencia Anchor Station (VAS) is based on code developed by Baseline Surface Radiation Network (BSRN) http://bsrn.ethz.ch/. At the moment, it's only applied to measured radiation parameters in the station (Downwelling and Upwelling Long wave radiation, Incident and Reflected Short wave radiation), but it is pretended a next ampliance for new meteorological parameters.
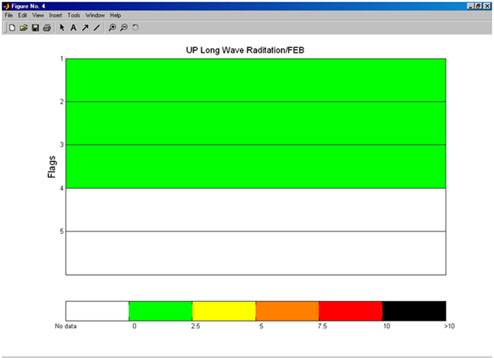
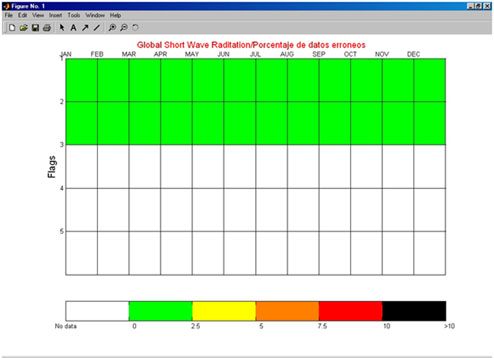
Quality Control run five analysis procedures for each data, every time more rigorous control operations to obtain an optimal result. When they get through every one of these controls are analyzed and labeled with a different control flag based on the result of this study. The result of these five flags digits give information about Quality Control realized. The quality codes together with the respective five quality control procedures are listed in the table below:
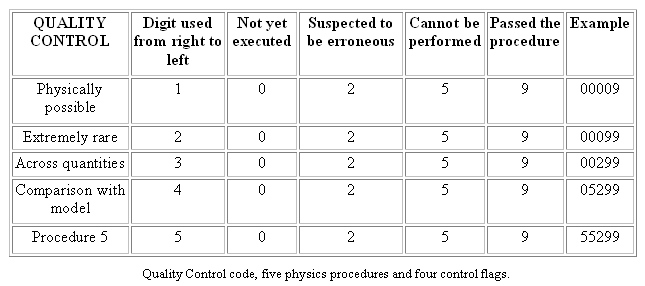
Last two procedures do not work yet, because of we have not physic model to run 4º procedure and 5º procedure is not yet defined.
In this section we are going to specify the incoming parameters in Quality Control, as well as the procedures used for each one of these parameters. The meaning of employed expressions on interval definitions can be seen in Anex. 1
- 1º Procedure: Physically possible limits
- 2º Procedure: Extremely rare limits
- 3º Procedure: Comparisons between magnitudes
1º Procedure: Physically possible limits
GLOBAL SW (DIRECT + DIFFUSE RADIATION)
Min: -4 Wm-2
Max: Sa x 1.5 x µ01.2 +
100 Wm-2
REFLECTED UPWELLING SW RADIATION
Min: -4 Wm-2
Max: Sa x 1.2 x µ01.2 +
50 Wm-2
DOWNWELLING LW RADIATION
Min: 40 Wm-2
Max: 700 Wm-2
UPWELLING EMITTED LW RADIATION
Min: 40 Wm-2
Max: 900 Wm-2
2º Procedure: Extremely rare limits
GLOBAL SW (DIRECT + DIFFUSE RADIATION)
Min: -2 Wm-2
Max: Sa x 1.2 x µ01.2 +
50 Wm-2
REFLECTED UPWELLING SW RADIATION
Min: -2
Wm-2
Max: Sa
x µ01.2 + 50 Wm-2
DOWNWELLING LW RADIATION
Min: 60 Wm-2
Max: 500 Wm-2
UPWELLING EMITTED LW RADIATION
Min: 60
Wm-2
Max: 700
Wm-2
3º Procedure: Comparisons between magnitudes
COMPARISON BETWEEN LWdown AND AIR TEMPERATURE (2m)
0.4 x sTa
< LWdown <
sTa
+ 25
COMPARISON BETWEEN LWup AND AIR TEMPERATURE (2m)
s(Ta 15
K)4 < LWup <
s(Ta + 25 K)4
COMPARISON BETWEEN DOWNWELLING AND UPWELLING LW
LWdown < Lwup
+ 25 Wm-2
LWdown > Lwup - 300 Wm-2
ANEX 1.
SZA = Solar Zenith Angle
µ0 = cos(SZA)
S0 = Solar constant at mean Earth-Sun distance,
S0= 1368 Wm-2
AU = Earht-Sun distance in Astronomical Units, 1 AU = Mean T-S distance
Sa = S0/AU2 = Solar constant adjusted for Earht-Sun distance
s = Stephan-Boltzman constant
= 5.67 x 10⁻⁸ Wm-2 K-4
Ta = Air temperature (2m) in Kelvin
Global SW: Incident SW mesured by unshaded pyranometer
Reflected SW radiation: Reflected SW mesured by unshaded pyranometer
LWdown: Downwelling LW mesured by pirgeometer
LWup: Upwelling LW mesured by pirgeometer