
The Data Interaction and Augmentation (DINA) research group of the Institute on Robotics and Information and Communication Technologies (IRTIC) of the University of Valencia has started its activities. Formed by a multidisciplinary team focused on ICT, it has four lines of research that explore the link between data and the people who interpret them, whether they are presented in a traditional way or with the possibility of interaction, and the use of elements such as augmented reality (AR) and virtual reality (VR).
"Data can be of a very diverse nature, representing very different concepts, with differing levels of detail, dimensions, meanings and even uncertainties," says Cristina Portalés, director of the DINA group, doctor and Ramón y Cajal researcher. Visualizing them correctly "helps the human being to understand their nature, meaning and scope," adds Portalés.
In this sense, says the team leader, "the various ways of accessing visual representations of data, including interaction paradigms such as virtual reality and augmented reality, add a fundamental element to their mere graphics, that is, they go beyond the static and allow the user to explore the data according to their needs and assimilate them". In addition, "they allow collaborative environments to manipulate, analyze and study these data," she notes.
The line focused on data visualization will explore the relationship that exists, at the level of perception, between types of data (continuous, discrete, categorical, etc.) and aesthetic variables (shape, size, color, etc.). In this field, the design and implementation of new proposals for graphs, graphs that show the relationships that exist between data and maps for the visual representation of data will be developed.
Through virtual reality technology, another arm of the group, immersive environments and the exploration of devices and hardware for interaction with the virtual environment will be carried out. Likewise, the graphic design and implementation of algorithms to visualize data in this virtual environment will be carried out, as well as methodologies to interact with them.
As part of the research line focused on ontologies, graphs will be used to map information. Data preprocessing for data homogenization, processing of terms according to thesauri, establishment of semantic relationships between data, database management and graph visualization will also be carried out.
The fourth of the DINA group's topics of interest, interaction, will explore graphical interfaces through the integration of data visualization using graphs and maps. In turn, it will address the needs of different target audiences in its usability studies for the improvement of interfaces.
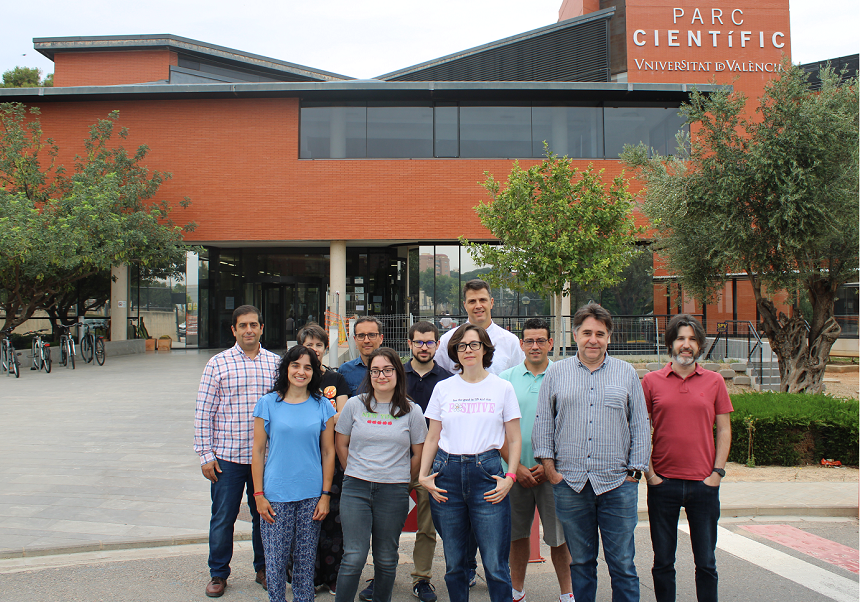
The team has members coming from the field of geomatics (geographic information management engineering), computer science and multimedia, as well as from the first promotion of Data Science at the University of Valencia. DINA has successfully completed projects such as SeMap and CreaLab, and is currently immersed in ClioViz.
"The interaction with the data is enriching and allows us to examine it from a visual perspective," says Portalés. In this sense, she continues, "a paper map is not the same as navigating through the data and studying it as we wish, delving into different layers that allow us to analyze it in greater depth."
The group wants to continue advancing its research in data analysis and visualization and contribute to consolidating the field of research. For example, with respect to interaction with data, augmented reality "is a territory to be explored," emphasizes the director of DINA, without leaving aside questions apparently already answered in this discipline that could be seen in a new light thanks to the new forms of study.
Therefore, DINA will play an important role in scientific research in data visualization, taking into account both the nature of the data and the visual variables and the human factor, as well as in the spatial analysis and visualization of georeferenced data.
The study of the design of thematic maps enriched with graphics and interaction paradigms (VR and AR) to enrich the visualization of data, proposing new ways of accessing them, is another of its objectives.