[<][<=][=>]Index of this webpage
**++Climatology from Satellites Group++**
**++Postgraduate++**
++Current Research Assistants (and Doctorate Students):++
++Doctorate on Remote Sensing Students:++
++Master Postgraduate:++
++Master Students:++
++Advanced Undergraduate:++
++Practicum - Practical Training:++
++Current External:++
++Past ..., but very close to us ...:++
**++Publications++**
**++Links to Significant Meetings++**
''**++2015++**''
''**++2014++**''
**++Active Collaborations++**
**++Acknowledgments**++
**++Book suggestions++**
**++Link of the Day++** (in reality, ... every now and then)
2013
December
**++Teaching Subjects++**
Postgraduate Course on ''New Observation and Watching Systems in Meteorology and Climatology''
**Some Teaching Publications**
**++Research Lines++**
**''I Validation of low spatial resolution remote sensing data and products (GERB, SMOS, EPS/MetOp, SMAP)''**
**''II Radiative balance studies (GERB, CERES, SEVIRI, EarthCARE)''**
**''III Soil moisture from passive microwaves (SMOS)''**
**++Valencia & Alacant Anchor Stations++**
**What is an ''ANCHOR STATION''**? (from Professor H.-J. Bolle)/
**Rationale**/
**Desirable measurements at ''Anchor Stations''**/
How Representative are the ''Alacant and the Valencia Anchor Stations'' Measurements of their Respective Surrounding Meteorology?
Proposal for a ''Water Cycle Observatory'': The VALENCIA and the ALACANT ANCHOR STATIONS, Meteorological Reference Stations for Remote Sensing Data and Products
**Publications**
2008
2007
2006
2005
2003
2002
**++Involvement in Satellite Earth Observation Missions++**
**SMOS (''Soil Moisture and Ocean Salinity'')**/
**SMOS Validation Rehearsal Campaign Activities at the Valencia Anchor Station**
**Scientific Team**
**Purpose**
**Activities
**SM Measurements**
**Vegetation Measurements**
**Soil texture**
**Airborne Operations during the SMOS Validation Rehearsal Campaign (Tauriainen, 2008)**
**Modelling**
**Publications**
2011
2010
2008
2007
2006
2005
2004
2003
2002
**Projects**
**EarthCARE (''Earth Clouds, Aerosols and Radiation Explorer'')**
**Publications**
2012
2011
2007
2006
2004
2003
2002
2001
**Projects**
**GERB (''Geostationary Earth Radiation Budget'')**/
**Publications**
2011
2008
2007
2006
2005
2004
2000
**Projects**
**CERES (''Clouds and the Earth's Radiant Energy System'')**/
**Publications**
2012
2008
2007
2006
2005
2004
2000
**Projects**
**EPS/MetOp (''EUMETSAT Polar System / MetOp'')**/
**Publications**
**Projects**
**++Other Significant Research Projects and Contracts++**
**Publications**
**++Field Campaigns++**
**++Supervision of Research Academic Work++**
**++Selected Significant Publications++**
**++Photographic Album: A Sample++**/
2014
2013
2012
2008
2007
2006
2005
2004
2003
2002
2001
2000
1988
[<][<=][=>][*]
How Representative are the ''Alacant and the Valencia Anchor Stations'' Measurements of their Respective Surrounding Meteorology?
The application of the Valencia and the Alacant Anchor Stations to validation activities of low spatial resolution Earth Observation remote sensing missions make it necessary to study the representativity and significance of the actual meteorological stations measurements with respect to the area they represent.
Meteorological simulations carried out with The Atmospheric Pollution Model (TAPM) (Hurley, 2005) carried out for the whole year of 2004 with the temporal resolution of one hour. The spatial resolution is 1 km, covering a total area of 75 x 75 km2. The grid is chosen such that the Anchor Station is placed in the central point, that is, the coordinate (38, 38).
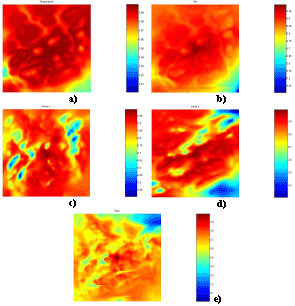
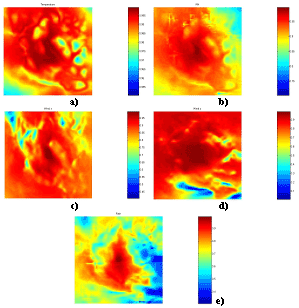
The correlation between the simulated time series for every grid point and the corresponding Anchor Station simulated values is established by means of the Pearson�s correlation coefficient. The following figures show the correlation maps obtained for the parameters analysed, namely, temperature, relative humidity, u and v wind components, and precipitation.

Correlation maps centered at the Alacant Anchor Station relative to the following meteorological parameters: a) temperature, b) relative humidity, c) u wind component, d) v wind component, e) precipitation

Correlation maps centered at the Valencia Anchor Station relative to the following meteorological parameters: a) temperature, b) relative humidity, c) u wind component, d) v wind component, e) precipitation
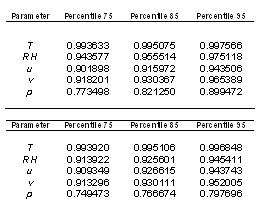
A limit has been established in the correlation coefficients for each of the parameters and the zone of influence of the whole station has been taken as the intersection of the zones obtained for each of the parameters. Instead of using five correlation coefficients �one for each parameter- a specific percentile value, namely, 75, 85 95, has been chosen as limiting value for each of the correlation coefficients, thus defining different approximations degrees. The values of the limiting correlation coefficients relative to each meteorological parameter and for each proposed percentile are given in the following Table 1 for both Anchor Stations.

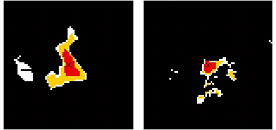
The graphical representation of the intersection of the areas obtained for each meteorological parameter is given in the followinf figure, where the red area represents the intersection of the zones obtained for each parameter taking as limiting R values those obtained for percentile 95; the yellow area for percentile 85 and the white area for percentile 75. The black area shows lower correlation values.

Demarcation of the Valencia and the Alacant Anchor Stations, respective representative areas with three approximation degrees: the red area represents the intersection of the zones obtained for each parameter taking as limiting R values those obtained for percentile 95; the yellow area for percentile 85 and the white area for percentile 75. The black area shows lower correlation values
[Hurley P. (2005): The Air Pollution Model (TAPM) Version 3. Part 1: Technical Description, CSIRO Atmospheric Research Technical Paper No. 55]

