Teleclima
PROMETEO/2021/016
The general objective of this project, entitled Analysis and modeling of trends in the Valencian Community in the context of Climate Change, is to study the changes in climate trends that are occurring in the Valencian Community as a result of anthropogenic changes introduced in the climate system, which allow us to foresee and anticipate possible problems with special attention to adverse phenomena (heat and cold waves, torrential floods, droughts, damage to agriculture, etc.) with potential impact on the environment. ) with potential impact on the population. The analysis will be carried out from a multidisciplinary perspective, using data from surface meteorological stations as well as from the different satellite constellations available from agencies such as ESA, NASA, NOAA or EUMETSAT, and from the European Copernicus system.
To this end, a multidisciplinary research team of researchers and experts in Earth physics and remote sensing from the Faculty of Physics of the University of Valencia (UV), and in meteorology-climatology and modeling from the Faculty of Geography and History of the UV is proposed. The description of the TELECLIMA group can be consulted in the group and members section.
The specific objectives of the project that we present are the following:
(i) Product validation and calibration of satellite sensors.
(ii) Development of new atmospheric correction methods and single and multichannel emissivity.
(iii) Validation of physical models for the calculation of the temperature of heterogeneous surfaces.
(iv) Obtaining a time series of land surface temperature (LST) images for the Valencian Community.
(v) Obtaining of a time series of meteorological data, specially temperatures and precipitations, over the Valencian Community.
(saw long ago) Analysis of the obtained time series and related meteorological data.
(vii)Use of artificial intelligence (AI) techniques and statistical downscaling for the analysis of temperature trends for the Valencian Community.
(viii) Calculation of the impact of climate change trends (TST and/or downscaling) on Mediterranean ecosystems, through the definition of bioclimatic indices.
variability, climate change, remote sensing, meteorology, atmosphere,
- Estrela Navarro, Maria Jose
- PDI-Catedratic/a d'Universitat
- Coll Company, Cesar
- PDI-Catedratic/a d'Universitat
- Director/a Titulacio Master Oficial
- Valor I Mico, Enric
- PDI-Catedratic/a d'Universitat
- Dega/Degana / Director/a Ets
- Niclos Corts, Raquel
- PDI-Catedratic/a d'Universitat
- Coordinador/a de Programa de Doctorat
- Garcia Santos, Vicente
- PDI-Titular d'Universitat
- Secretari/a de Departament
- Gala Tomás Portalés
- Óscar Soriano Masiá
- Martí Perelló Roselló
- David Orgambides García
- Christian Lorente Blanco
- David Corell Custardoy
- Arribas March, Sara
- PI-Pred_Conselleria Acif Gva
- Corell Custardoy, David
- PDI-Ajudant Doctor/A
- Garcia Ten, Alejandro
- PI-Invest Formacio Predoc Fpu
Postal address:
Department of Physics of the Earth and Thermodynamics
Faculty of Physics. Burjassot Campus Bloc C.
C/. Doctor Moliner, 50.
46100 Burjassot - València (Spain)
E-mail: Raquel.Niclos (at) uv.es
Secretary of the Department of Physics of the Earth and Thermodynamics
Telephone: (+34) 96 354 43 50
Fax: (+34) 96 354 33 85
VALIDATION OF SATELLITE LAND SURFACE TEMPERATURE DATA
Multiple validations of different satellite land surface temperature (LST) data have taken place during this period of time, making use of thermal radiometric data measured by the field team at the experimental zones (such as the Valencian rice fields).
The validation activities are needed to stablish the real precision and accuracy of the satellite LST estimates. The following pictures shows validation zones of the LST products from the eastern side of the Iberian Peninsula. In each area, the surface emissivity is measured according to its own nature and the seasonal evolution of the vegetation. Thus, the R-based LST data validation method can be applied to the information provided by different satellites (MODIS, Sentinel-3, MetOp,…) from a variety of areas throughout time.
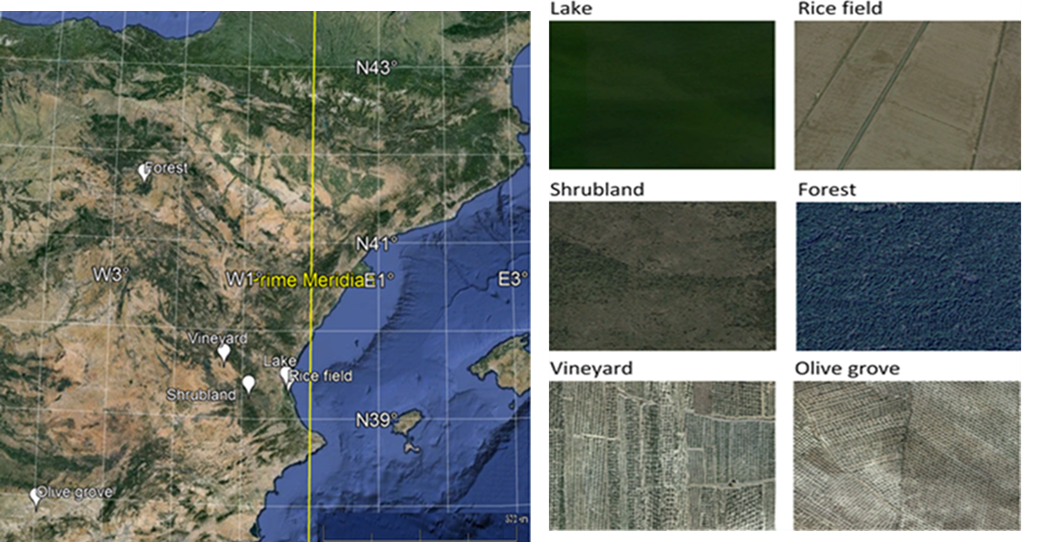
Satellite land surface temperature (LST) validation data areas of the eastern side of Iberian Peninsula.
The LST data of the satellites MODIS (Terra and Aqua) M*D11 and M*D21 has been validated. The global results indicated a systematic deviation within ±0.5 K and a standard error of about 1.0 K for both products, which confirms the great quality of the MODIS LST data (Coll et al. 2024; https://doi.org/10.1109/TGRS.2024.3454377).
VALIDATION AND COMPARATION OF TEMPERATURE-EMISSIVITY SEPARATION METHODS
Separating emissivity from temperature is a key challenge in satellite TST measurement, and it is a crucial element to understand the energetic balance and radiative exchange of Earth surface. The most widespread methods to tackle this problem are the Temperature-Emissivity Separation (TES) and Split-Window (SW).
In this project, we have adopted the ANEM methodology together with the SBAC atmospheric correction method to the MODIS and VIIRS sensors, validating and comparing it to the TES and SW methods, which were active in a region with diverse land cover (Albufera de Valencia).
This algorithms were evaluated using in situ measurements from an area with diverse land cover between 2002 and 2022, including rice fields, vegetation, raw floor, water and urban areas. The spectral library ECOSTRESS has been employed as well as data from the MODIS and VIIRS sensors, with resolutions of 1 km and 750 m respectively.
The results show that the ANEM method achieves a mean squared error (RMSE) of 1.1 K for MODIS/Terra, 1.3 K for MODIS/Aqua and 1.5 K for VIIRS/Suomi-NPP. In comparison, TES achieves a 1.4 K (MODIS/Terra) and 1.7 K (MODIS/Aqua y VIIRS/Suomi-NPP), while SW shows a RMSE of 1.2 K (MODIS/Terra), 0.9 K (MODIS/Aqua) and 1.9 K (VIIRS/Suomi-NPP).
Through maps of pixel to pixel difference (ANEM-TES and ANEM-SW), irregularities have been identified depending on the type of land cover, as it can be seen in the following picture.

Maps showing the difference between ANEM-SBAC and TES for Terra (right) and VIIRS (left).
The results show great similarity between the ANEM and TES methods in the LST estimation, with remainders close to 0 K in almost every cover, except in water class, in which ANEM usually estimates a slightly lower LST. This is due to the fact that TES includes the water pixels, while ANEM assigns an emissivity based on the subpixel spectral mix, which generates a negative bias. Regarding the SW method, a constant positive bias (1 K - 2 K) is observed in all the classes due to its emissivity overestimation. In the Aqua sensor, the least represented class (water) shows a great dispersion due to the lower amount of data collected in comparison with Terra. For VIIRS, the SW algorithm shows considerable variations depending on the type of cover: forests with a cover between the 30-60% and farm land give a positive difference, while the rest of the classes stay close to the 0 K, which differs from the usual SW trends to estimate lower temperatures.
In short, the ANEM-SBAC method is an alternative to the traditional methods and is applicable to other regions and satellite missions. This method is understood as a support for the future development of high resolution thermal sensors, as versatile methodologies will be needed to improve the precision of temperature and emissivity estimation, optimising the existing operational products.
VALIDATION OF VEGETATION INDEX BASED MODELS TO DETERMINE THE FRACTIONAL VEGETAL COVER
The fractional vegetal cover (FVC) is an essential biophysical parameter for the characterisation of land ecosystems and their evolution, key factors in the current climate change context. Spatial FVC monitoring with remote sensing tools usually requires physical models using vegetation indices.
In this study a group of models used to calculated FVC was analysed, from those physically based, like the Dimidiate Pixel Model (or lineal model with the vegetation index, evaluated for up to 29 different vegetation indices), to automatic learning models (Machine Learning). Images from the Landsat 7 ETM+ y Landsat 8 OLI corresponding to different regions of the world.
The validation of the FVC results obtained from the different models was done with the field data from the projects VALERI (Validation of Land European Remote sensing Instruments, http://w3.avignon.inra.fr/valeri/) and ImagineS (Implementing Multi-scale AGricultural Indicators Exploiting Sentinels, https://fp7-imagines.eu/).
The following figure provides a FVC comparison example of three different models based on vegetation indices. Similarities but also significant differences can be seen in some surface types.

Comparison of the FVC estimation for different models of the Barrax area.
The results show how some models based on vegetation indices give less accurate estimations in both studies (data from different satellites validated with multiple field data databases). In addition, the Machine Learning models presented an improvement in the accuracy of the FVC estimation.
For example, the following picture shows the robust RMSE results for multiple models using vegetation indices. It can be seen how the precision trend of the models is similar, both for the FVC derived from models using Landsat 7 ETM+ data and field measurements of the VALERI project, as well as the Landsat 8 OLI data and field measurements of the ImageneS project. To be highlighted the lineal model used by the NDVIc2 and the SAVI, which show a better performance in the fractional vegetal cover estimation.
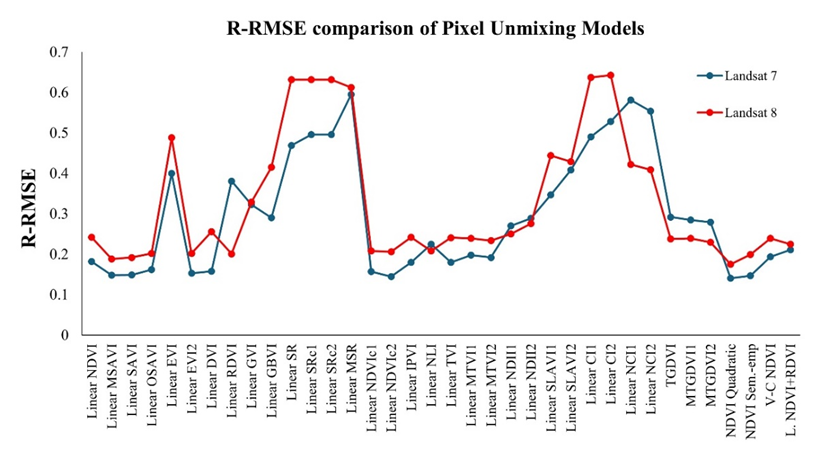
RRMSE for different FVC models based on vegetation indices.
On the other hand, DP models using NDVI, NDVIc2 and SAVI, the quadratic model with NDVI and the semi-empiric model with NDVI were compared with regression and Machine Learning models (Random Forest – RF, Support Vector Machine for regression – SVR and Gaussain Process regression – GPR). Particularly, the Machine Learning models have been trained with three different data combinations: the combination of the best vegetation indices (according to the previous study of the linear models with them), the spectral bands of the sensors, and the combination of these two data sets.
The accuracy improvement of the Machine Learning models is crystal clear; with a reduction of 0.15 in RRMSE when comparing the widespread model to calculate the FVC with the NDVI against the Random Forest model trained with the combination of the vegetation indices. Nonetheless, it is important to take into account the models with a physical base, as they do not require field data for their application and have proved a considerable accuracy in the estimation of the fractional vegetal cover.
ANÀLISI DE TENDÈNCIES I EXTREMES EN LA TEMPERATURA
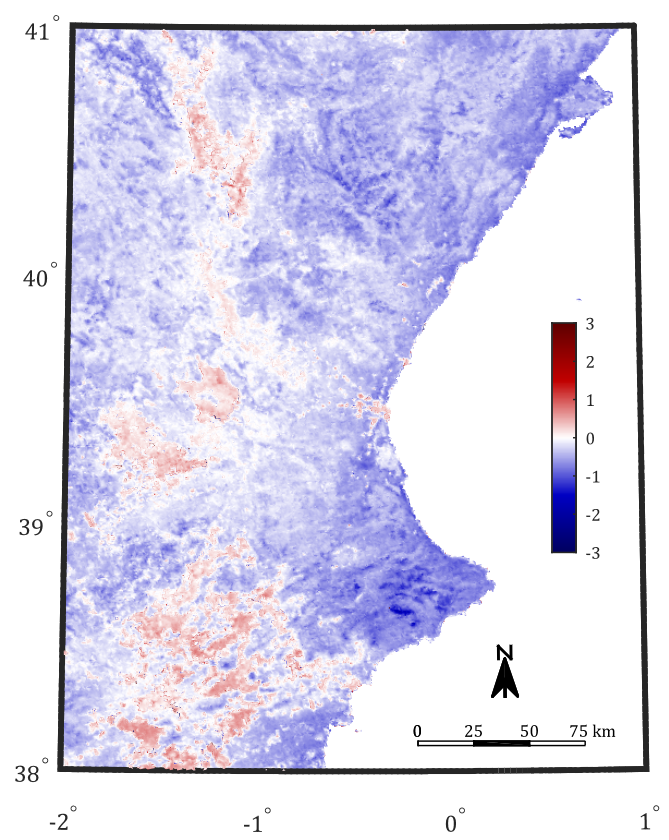
L'anàlisi del producte ESA Climate Change Initiative (LST-CCI) derivat de les dades d'EOS-Aqua MODIS, que es mostra en les figures següents, ha mostrat tendències d'augment de la temperatura en el període 2002-2018. Aquestes tendències són significatives en més d'una cinquena part de la Península durant el dia, amb una mitjana de 0,10ºC/any, i en més d'una tercera part durant la nit, amb una mitjana de 0,07ºC/any.

Figura A
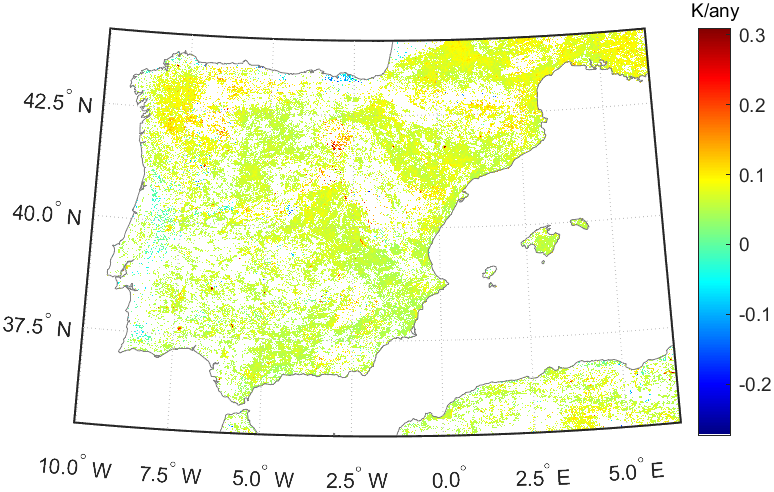
Figura B
LST trend during the day (a) and night (b) at the Iberian Peninsula between 2002 and 2018, obtained from the LST results of CCI derived from the EOS-Aqua MODIS data (1 km spatial resolution).
THE TEMPERATURE VARIABILITY IN SPAIN
The temperature increase in Spain hasn’t been a lineal phenomena. Throughout the last century, we have experienced different heating and cooling phases, some of them marked by abrupt changes.
If we take a look at the temperatures from 1916 to 2022, we can identify three big phases:
- A slight increase until the 50s, with an overall moderate increase in temperatures.
- A stability and cooling phase between 1960 and 1970, in which temperatures dropped significantly.
- An accelerated increase from the 70s until the current days, in which the warming has been specially intense. Even though some studies suggest a slight break between 2000 and 2014, the data from 2015 onwards indicate an upwards trend.
In fact, 2022, 2020 and 2017 have been the warmest years ever registered in Spain, and 8 out of the 10 hottest years of the whole data set belong to the 21st Century.

Annual daily average temperature variation in mainland Spain between 1916 and 2022 expressed in anomalies (in °C) with regards to the average of the period between 1951 and 2010 (data obtained from Sandonis et al., 2021 and from AEMET, 2022)
How will the temperatures in Spain change in the future?
Climate change is transforming our planet, and Spain is no exception. According to the projections obtained from 16 climate models from the Euro-CORDEX initiative, temperatures will keep on increasing during the following decades. These forecasts, which reach a 10 km spatial resolution, allow us to better understand the expected changes at a regional level.
According to the data, the interior of the Peninsula will suffer the greatest maximum temperature increase, specially affecting regions such as Madrid, Castilla y León, Castilla-La Mancha and Extremadura. In these areas, the warming will be more severe during the first few decades of the century, reaching its highest point halfway through the century to then stabilise itself.
Conversely, northern Spain regions (Galicia, Asturias, Cantabria and the País Vasco), together with the Balearic Islands, will see a more moderate warming, although it will be maintained until the end of the century.
If we analyse each season independently, projections show that summer and autumn will suffer the most significant temperature increases. In the near future, autumn is expected to have the greatest increase, while in the medium and distant future, summer will be the season wit the biggest increases.
On average, autumn could register a 3.4 °C increase, and the Comunidad de Madrid will be the most affected, with an maximum increase of up to 3.8 °C.
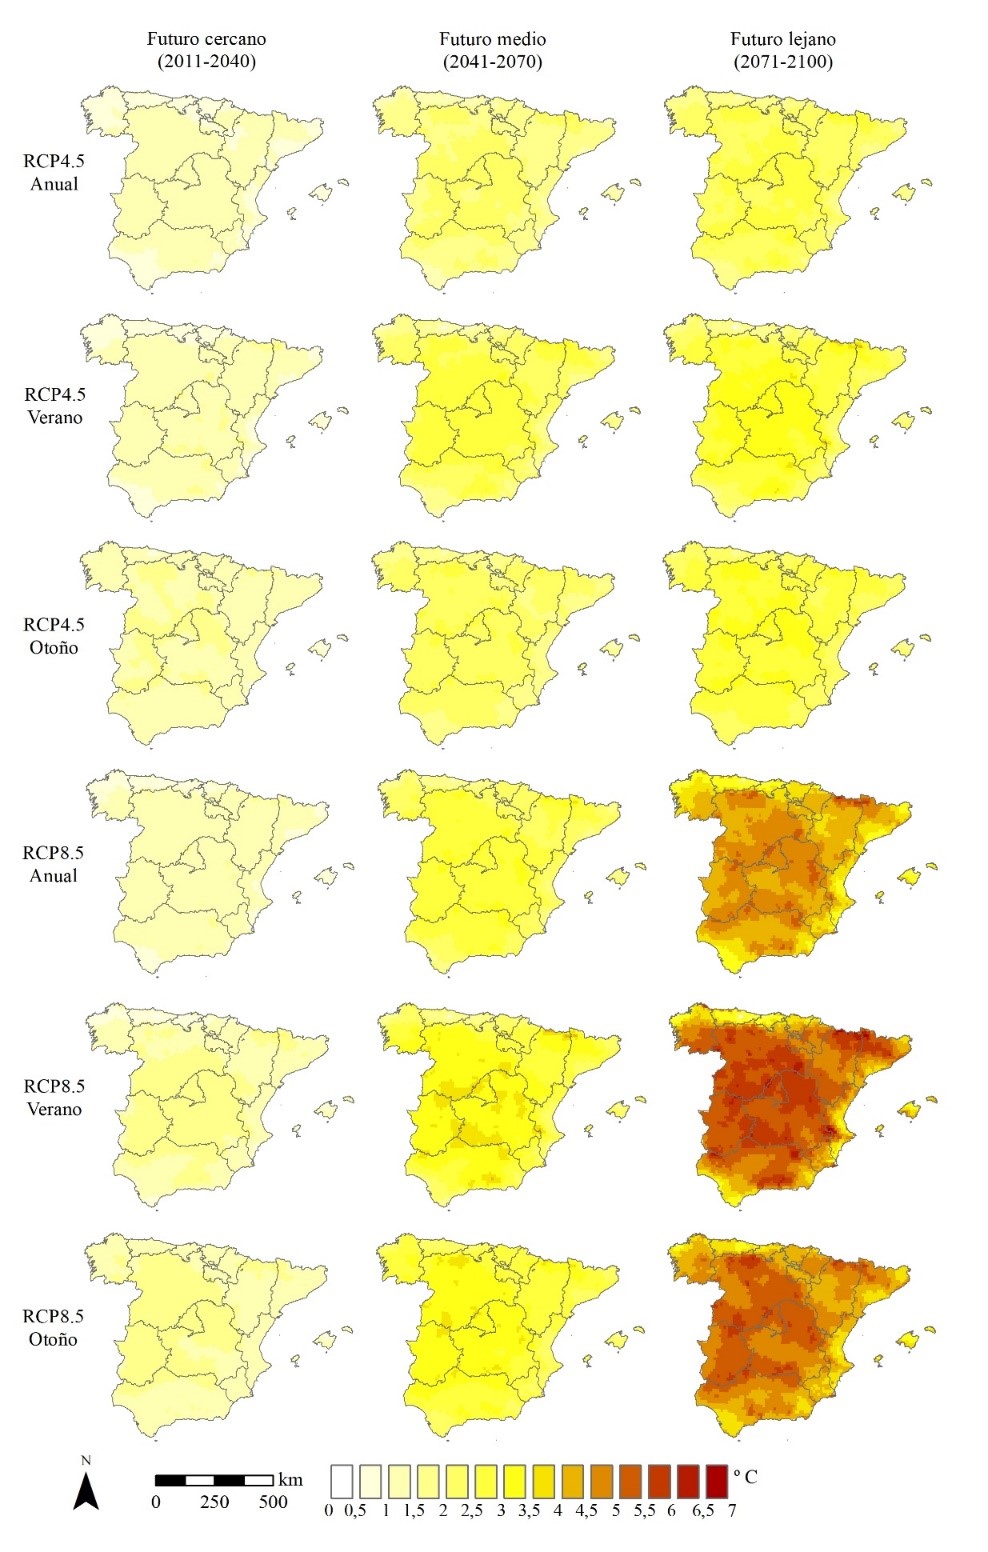
Annual maximum average temperature (ºC) average change of summer (JJA) and autumn (SON), for the 2011-2040 (left), 2041-2070 (centre) y 2071-2100 (right) periods regarding the reference period (1971-2000) in the RCP4.5 scenario. Data extracted from dynamic regionalisation’s generated by the Euro-CORDEX initiative (https://cordex.org/) with regional climate models, which provide grid data with an approximate resolution of 10 km (data obtained from AdapteCCa).
WATER AND CLIMATE CHANGE: IMPACT AND CHALLENGES FOR THE FUTURE
Climate change is significantly affecting the water cycle, with repercussions in the availability of water resources and in rainfall distribution. This phenomena has direct consequences on the ecosystems and society, as it modifies climate patters and generates extreme events like droughts and floods.
The role of water in climate change
The water in the atmosphere, even though it represents only a small percentage of the total water of the planet, plays a key role in climate regulation. Water vapour is the main greenhouse effect gas, absorbing radiation and contributing to the thermal stability of the planet. In addition, the hydrological cycle, consisting of evaporation, condensation and precipitation, is essential for the global climate equilibrium.
Projections indicate that global warming will increase the water retention capacity of the atmosphere, which, in turn, will increase the frequency and intensity of extreme precipitations. At the same time, an increase of droughts in certain regions is expected, which will affect the availability of water for human consumption, agriculture and natural ecosystems.
The effects of climate change in the precipitations
The changes in precipitations do not affect every region equally. In the Mediterranean basin, for example, trends towards a decrease of rain in the interior areas have been observed, while in the costal areas the precipitations gather in more intense an torrential episodes.
This patters supposes a challenge for the water management, as torrential rainfall generate surface run-off instead of leaking into the floor, reducing the aquifers reserves and increasing the risk of floods. In comparison, the decrease of precipitation in mountain areas puts in risk the water level of rivers and the availability of drinking water.
Towards a sustainable water management
In order to face the challenges on the water resources that climate change brings, it is a must to adapt management strategies, including:
- Optimisation of water usage in the domestic, agricultural and industrial spheres.
- Monitoring the changes in precipitations and adapting storage and distribution infrastructures.
- Incorporation of new technologies like the harvesting of mist water in areas with hydric stress.
- Environmental awareness and education to promote a more efficient usage of water.
Alternatives to face the reduction of precipitations
In a context of reduction of precipitations in some regions, harvesting mist water is laid as a plausible strategy to improve the availability of water resources, following the Sustainable Development Goal 13 (Climate Action). This technique is already implemented in countries like Chile, Morocco and Spain, where it is used for human use, watering the farmlands and reforestation.
Principles behind harvesting mist water
The system to harvest mist water is based on the used of plastic nets that hold the water drops in suspension. These condense on the surface of the material and drip towards a storage system.
The advection mists are the ones most suitable for this process, as they are generated over the sea and moved towards the interior by the wind. When these masses of humid air come into contact with the first mountain elevations close to the shore, the mist formation is favoured and, thus, the harvest of its water.
A series of key geographic factors have been identified for the efficient harvesting of mist water:
- Altitude: Between 500 and 1300 metres to secure a bigger mist concentration.
- Orientation: Hills exposed to the sea that make the arrival of humid air masses easy.
- Gradient: Areas with low or non-existent inclination to facilitate the harvester installation.
- Distance to the sea: Less than 100 km from the shore, preferably, the most favourable being within the closest 20 km.
Areas with the biggest potential in the Valencian Community
The areas of the Valencian Community in which harvesting mist water is viable have been identified. Some of the areas with better conditions are:
- Las Palmas desert
- El Garbí
- Mondúver
- Montgó
- Bernia mountain range
The studies have registered over annual harvests of over 1100 litres per squared metre of net in these places, which reaffirms the viability of this technique in the region.
Perspectives of mist water harvesting
Exploiting the mist as a complementary hydric resource can improve the resilience against the climate change in areas with hydric stress. Its implementation could benefit the ecosystem conservation as well as the water supply and the development of agricultural activities in areas with limited water availability.
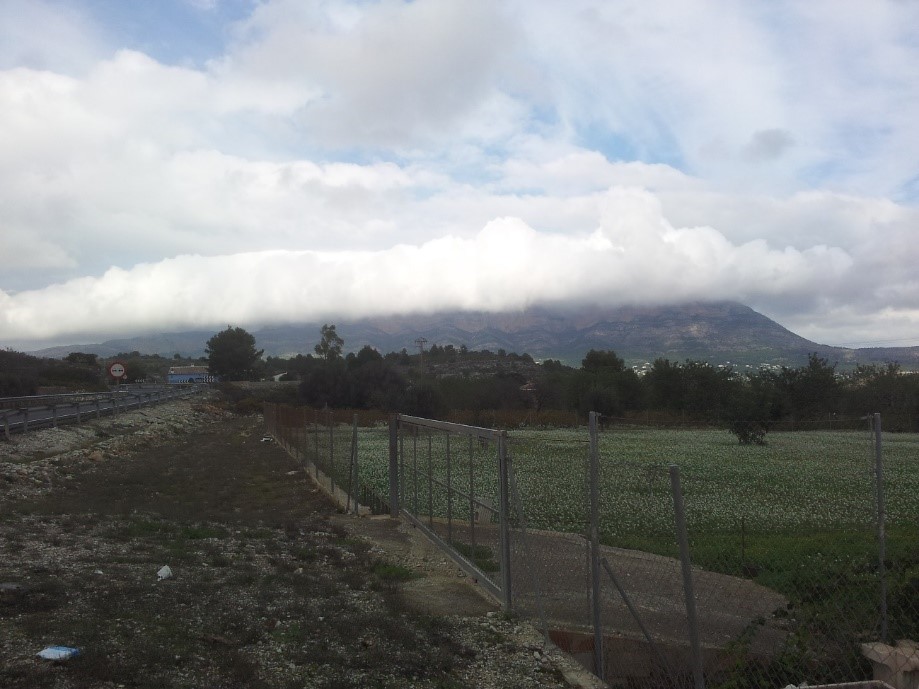
The Montgó, in the background, covered by a thick mist, on 22 November 2012 (author: David Corell).
THE DROUGHTS AT THE HEADWATERS OF OUR RIVERS
The headwaters of our rivers are drying up. Through a study using the data from a period of the 70s, we have detected a considerable loss of precipitations in two key areas for the Valencian Community: the area of the Iberian System, which has the source of the Júcar and Turia rivers, and the area of the Betic System, where the Segura river is born. In addition, these areas also have the sources of rivers like the Tajo and Guadalquivir, waters of which flow into the Atlantic ocean and are crucial for the regions which they flow through.
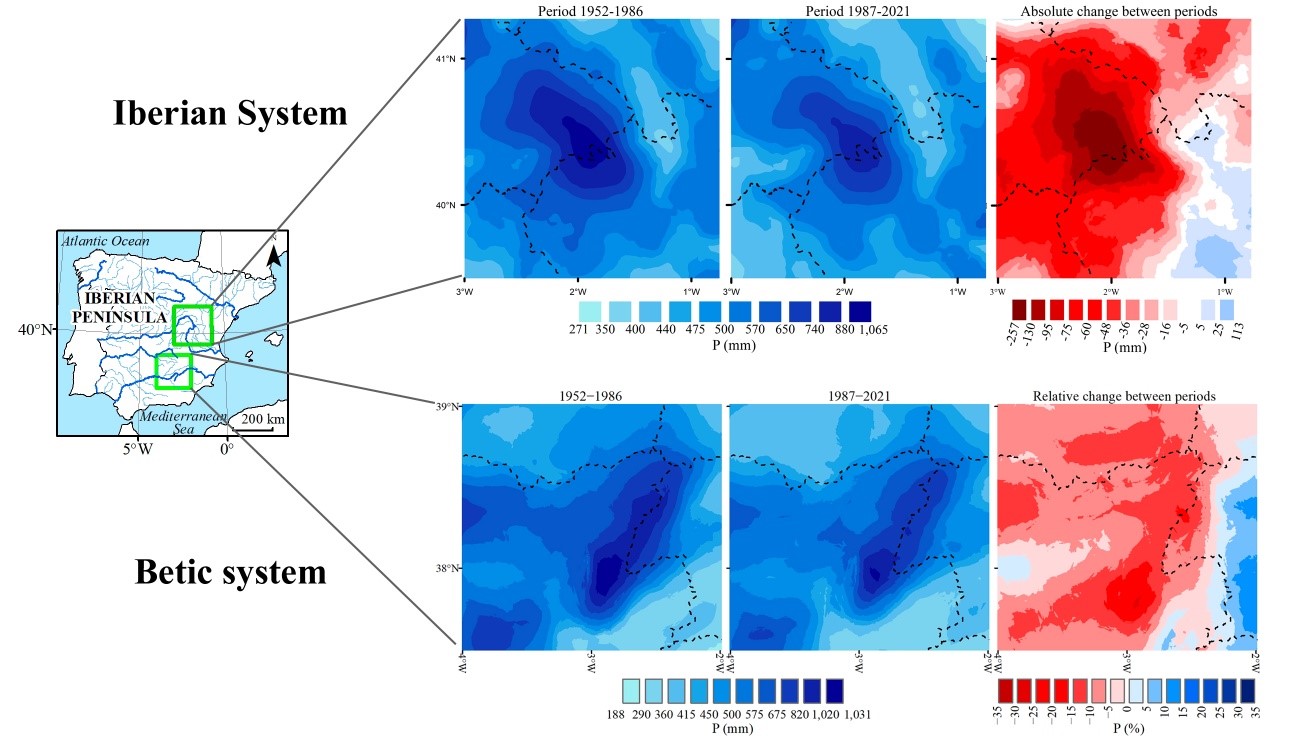
Comparison of the registered precipitation in the 1952-1986 and 1987-2022 periods in two key areas of the Iberian System (top) and the Betic System (bottom)
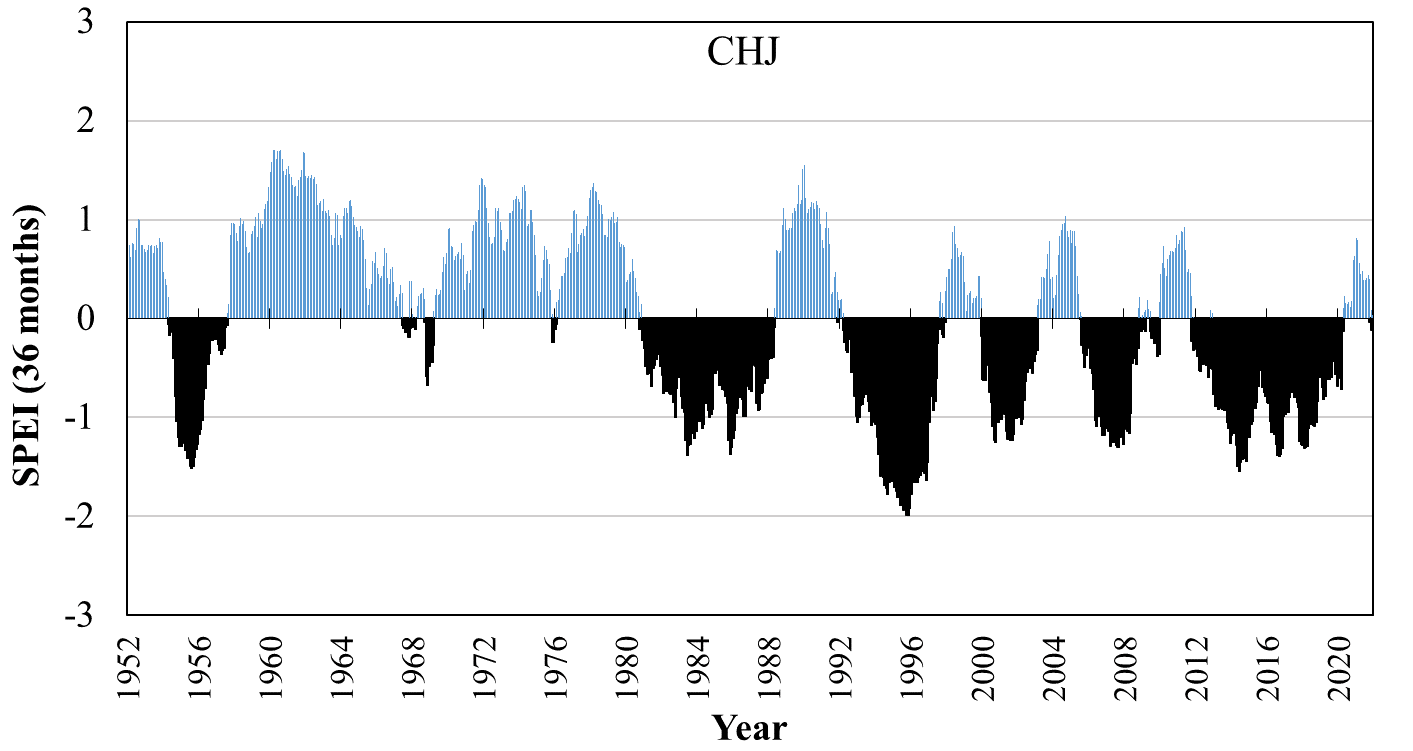
Standardised Precipitation Evapotranspiration Index (SPEI) values at the headwaters of the Júcar river, which indicate an extended drought since the 80s (negative values, in black)
HARVESTING MIST WATER AS A NEW HYDRIC RESOURCE
The loss of registered precipitations in some key areas of our territory forces us to search for new water supply sources. Harvesting mist water can become a small scale alternative in some locations. We have analysed mist harvesting data from different mountainous points of the Mediterranean coast, with surprising results. One of them is the possibility of collecting mist water in many dry days (without precipitations) throughout all the seasons of the year. At the same time, it has been observed that mist water harvesting is more frequent during summer in some of these places. We have also detected significant correlations between the monthly harvest of mist water and some of the main teleconnection indices, which will allow us to improve the future harvest forecasts.
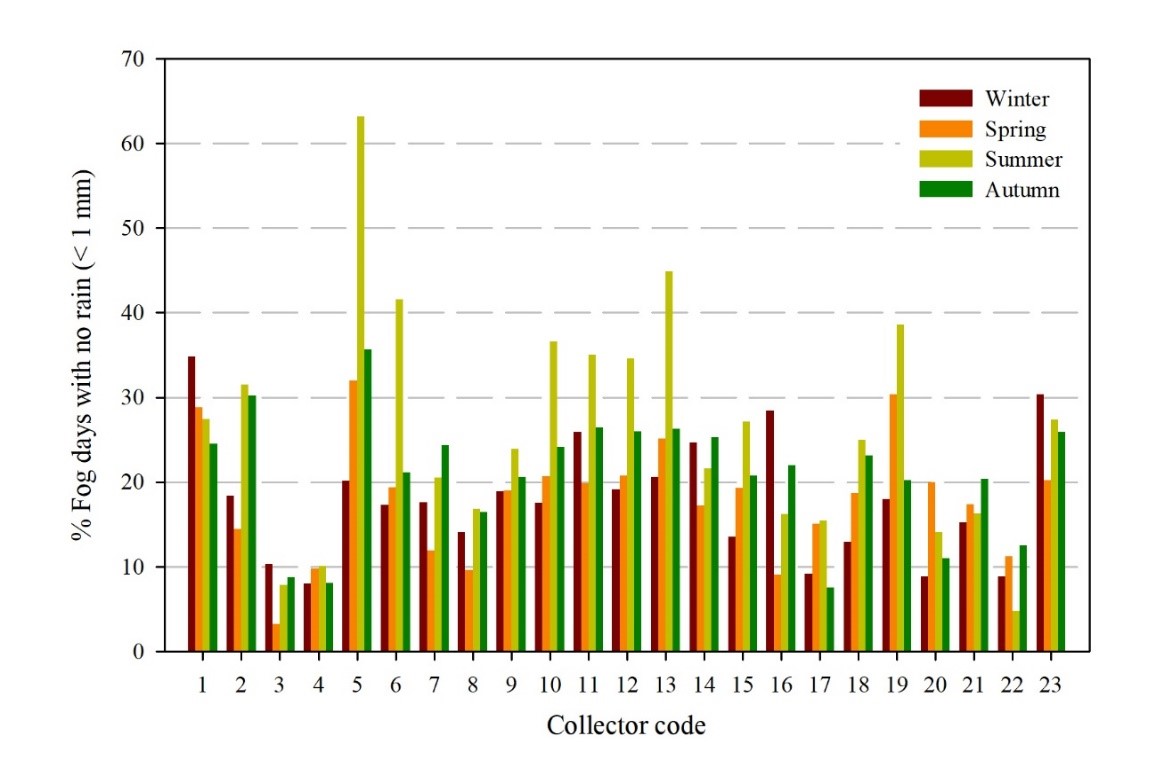
Percentage of days without precipitations in which harvesting mist water is possible. 23 different locations throughout the Mediterranean coast have been analysed, from Gerona to Almería, and the results of each one of them are shown in the figure. The locations are ordered from north to south
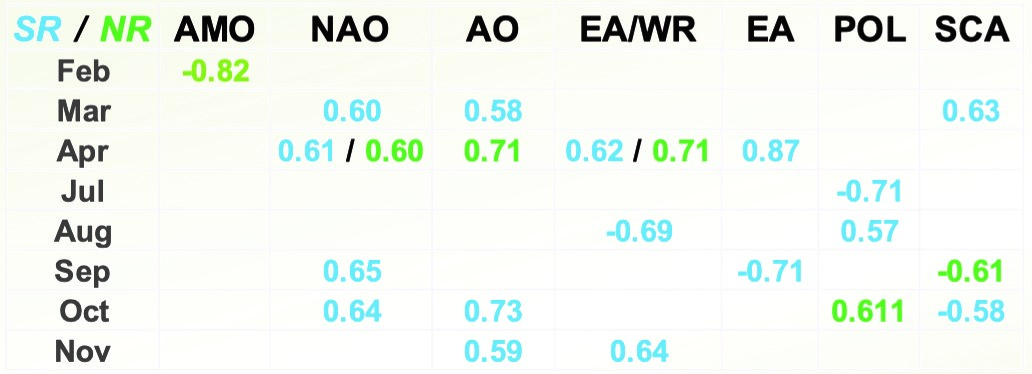
Correlació entre la recol·lecció de boira en dues zones de la Comunitat Valenciana (SR al sud i NR al nord) i alguns índexs de teleconnexió climàtica (AMO (Oscil·lació Multidecadal de l'Atlàntic); NAO (Oscil·lació de l'Atlàntic Nord); AO (Oscil·lació Àrtica); WR (Règim d'Oest); EA (Patró de l'Atlàntic Est); POL (Patró Polar/Euroasiàtic); SCA (Patró Escandinau)).
IMPACT OF THE CLIMATE CHANGE IN THE BIOCLIMATIC CONDITIONS OF SPAIN AND BALEARIC ISLANDS (1953-2022)
Climate change is modifying the temperature and precipitation patters of the Iberian Peninsula and the Balearic Islands, which could affect the distribution of the vegetation communities of the region. A preliminary study of the issue has been carried out in this project, which will be further developed in the new proposal submitted in 2025. The analysis shows the evolution of the bioclimatic units between 1953 and 2022, using data from 3668 meteorological stations distributed all throughout the territory. The future project will delve into and broaden the evaluation including the analysis of satellite data.
In order to evaluate these changes, two 35 year periods were compared: 1953-1987 and 1988-2022, analysing variations in both the macrobioclimates (huge climatic units) as well as in the bioclimates (more detailed subcategories within the macrobioclimates).
Main findings of the study
The preliminary results show an expansion of the Mediterranean macrobioclimate, which total surface has grown by a 6.93 % mainly at the expense of the mild microbioclimate. This change is consistent with the generalised temperature increase and the humidity decrease of the region.
Regarding the bioclimates, a trend towards the more arid and continental conditions in the Mediterranean areas is observed, while the mils areas show a more progressive homogenisation of the climatic conditions. This suggests that the climatic differences between multiple mild regions are reducing over time.
Likewise, two new types of bioclimates have been identified in the region, which indicate the appearance weather conditions that had never been registered previously in the area of study.
Consequences for biodiversity and conservation
The observed changes can have significant consequences for biodiversity, specially in mountain and bioclimatic transition areas. The endemic species of these environments could face a greater risk of habitat loss due to the modifications of the weather conditions.
These results can improve the environmental planning through the design of conservation strategies adjusted to climate change, the implementation of monitoring systems to detect future bioclimatic variations and the development of early warning mechanisms for the protection of vulnerable ecosystems.
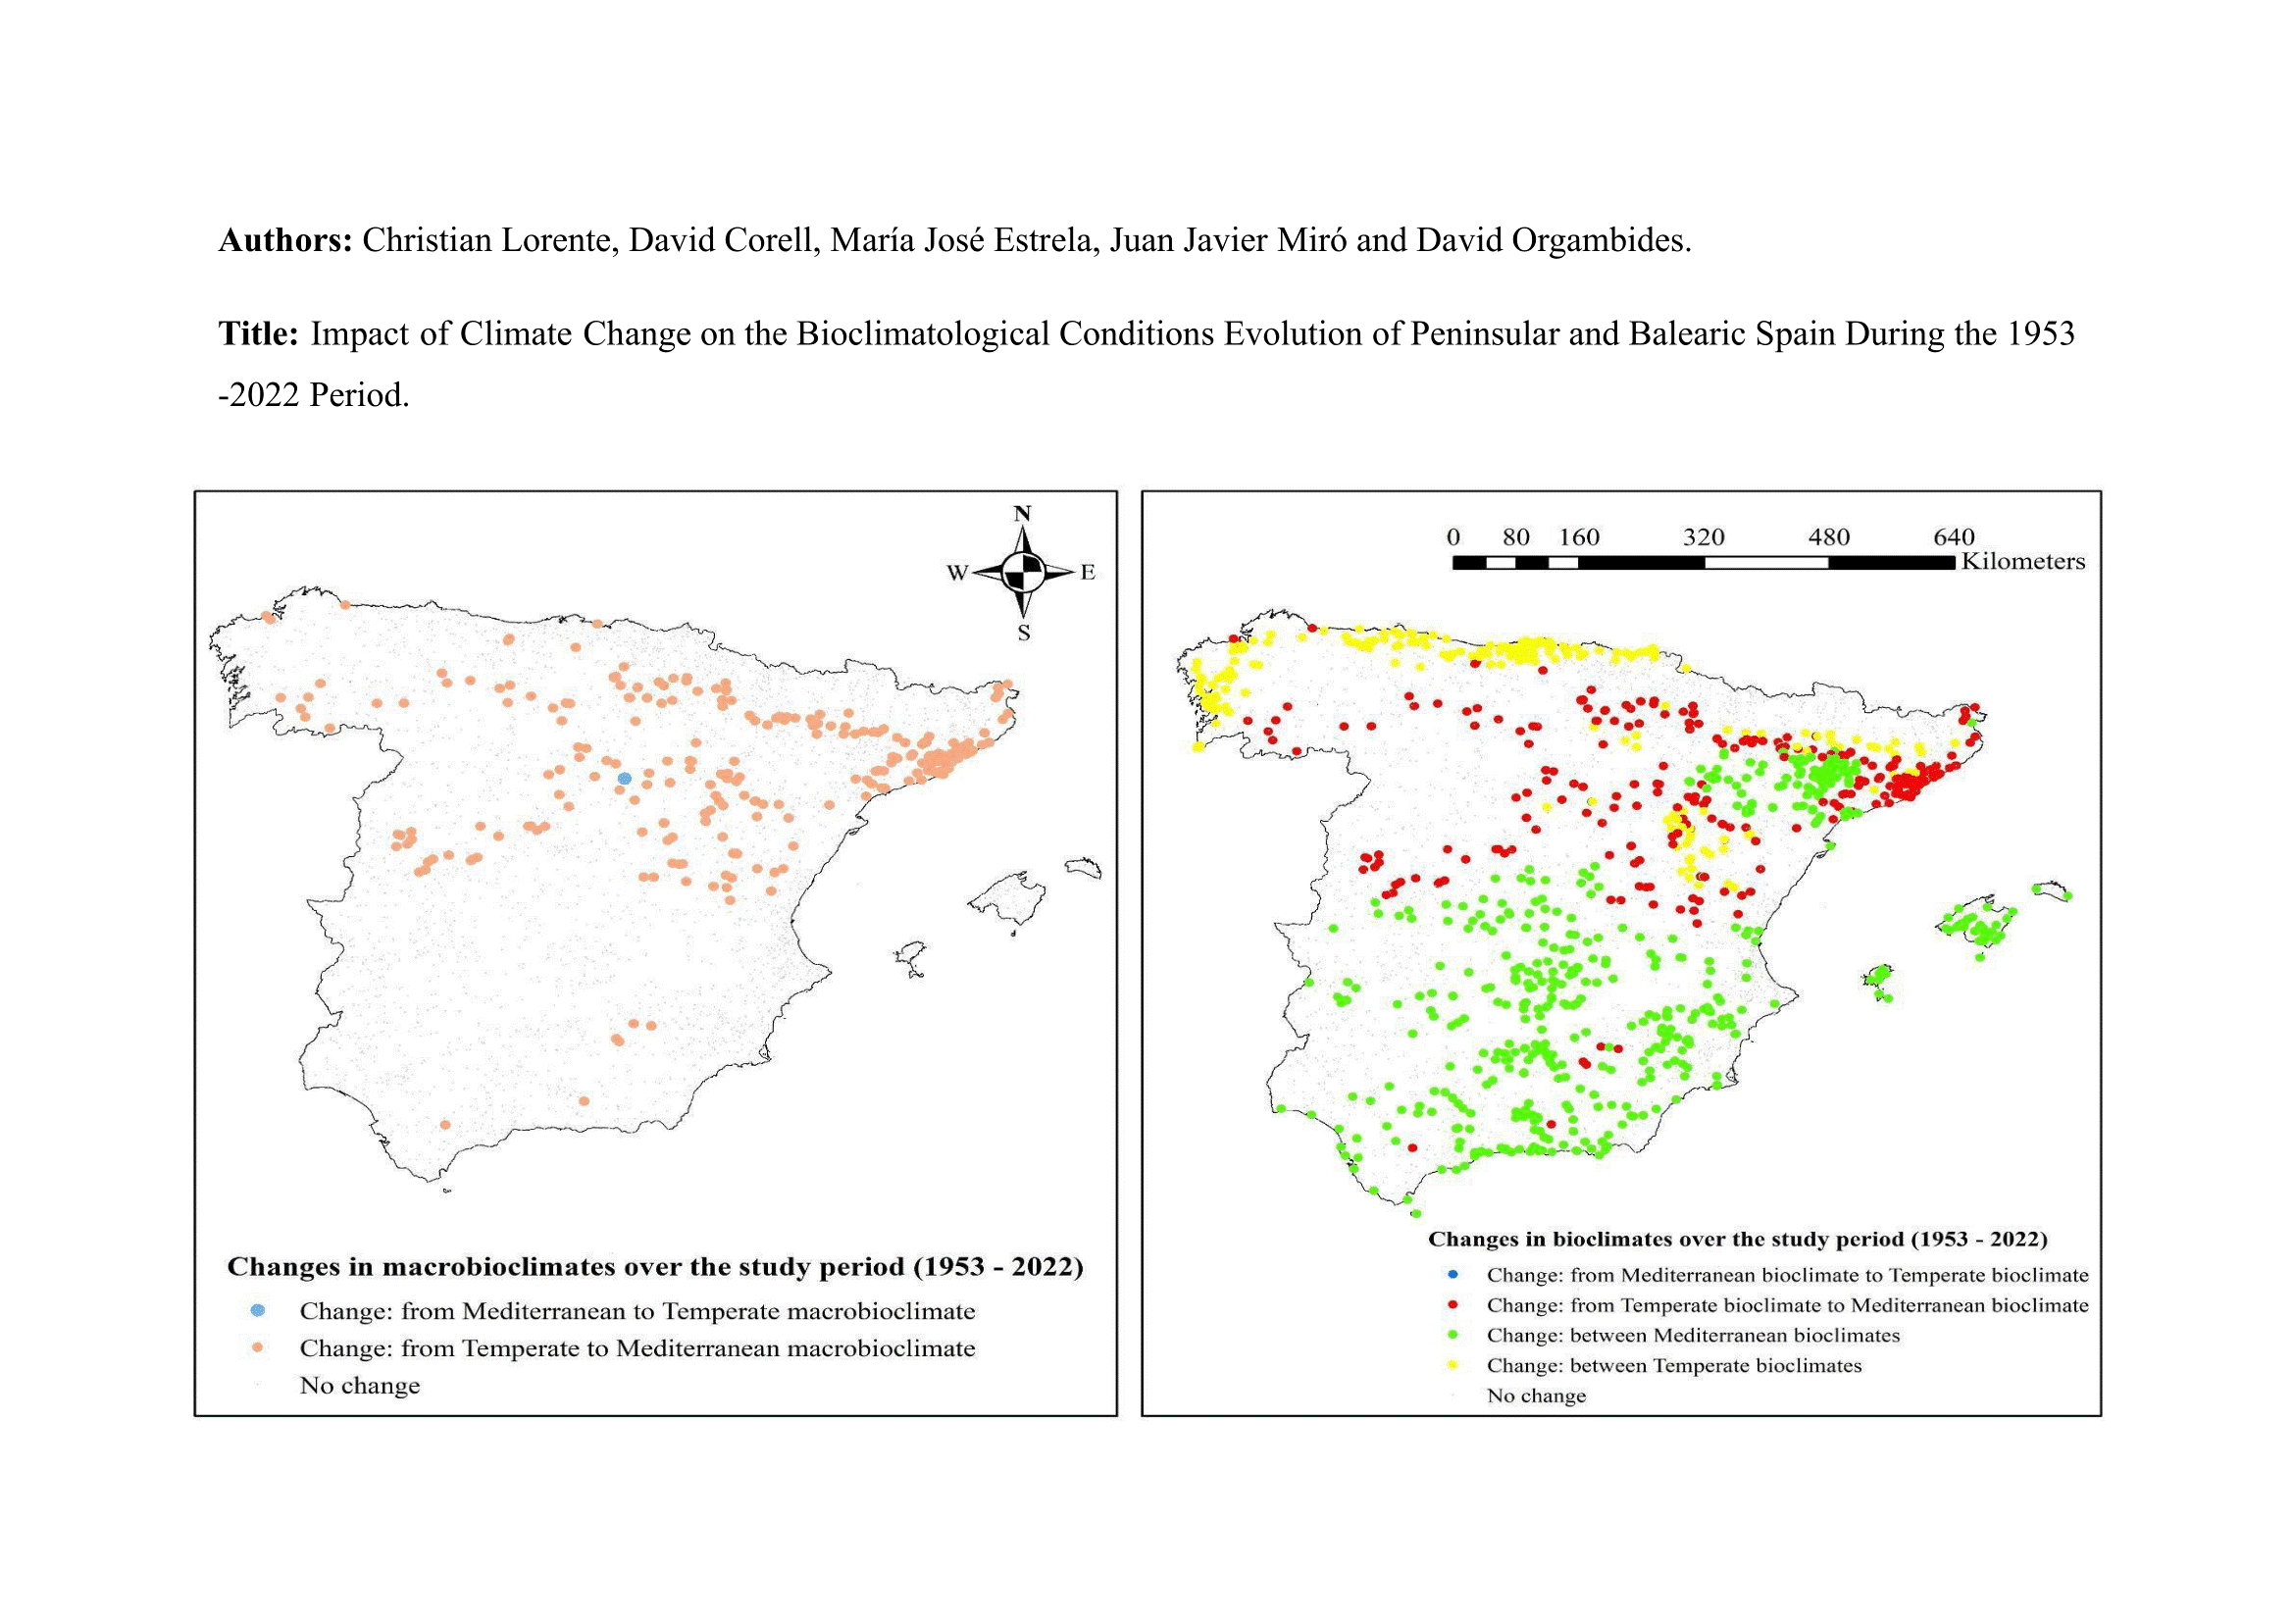
Changes in the bioclimatic conditions in Spain and the Balearic Islands (1953-2022): Macrobioclimate and bioclimate variations due to climate change.
THE RISING RISK OF WILDFIRES IN THE IBERIAN PENINSULA: TRENDS AND KEY FACTORS
Climate change is modifying the meteorological conditions of the Iberian Peninsula, rising the frequency and intensity of extreme phenomena, such as heatwaves and extended droughts. One of the most worrying effects is the increasing risk of wildfires, a phenomena affecting not only the ecosystems, but also the safety of the population.
In order to evaluate this trend, the Fire Weather Index (FWI) evolution has been analysed, a metric used globally to estimate the risk of wildfires from climate variables. This study examines the changes of the FWI in the Iberian Peninsula between 1971 and 2022, using a data set with daily values from the index in a 0,25° × 0,25° grid.
Main results of the analysis
- Rising FWI trend: A significant increase of the index in the whole area of study has been observed, with a statistical confidence of 99%.
- Temperature and precipitation influence: On the long term, the FWI increase is mainly determined by the increase in temperature. However, annually, precipitations play a key role in the index variability.
- Spatial and temporal differences: The FWI behaviour is not uniform throughout the territory nor the seasons. While in some areas the increase is more noticeable, the change is more moderate in others.
- Greater increase in summer and winter: The greatest FWI increases have been registered in summer and winter, meanwhile, in autumn, there were no significant statistic changes.
- Increase of extreme risk episodes: An increase in the frequency of high or extreme risk values is observed, which indicates a greater predisposition for large scale wildfires in the territory.
- Greater vulnerability in the north and interior: The FWI has increased more rapidly at the areas located to the north of the Mediterranean region, at a greater distance from the sea, and in areas of higher altitude, with the Iberian System as the most affected region.
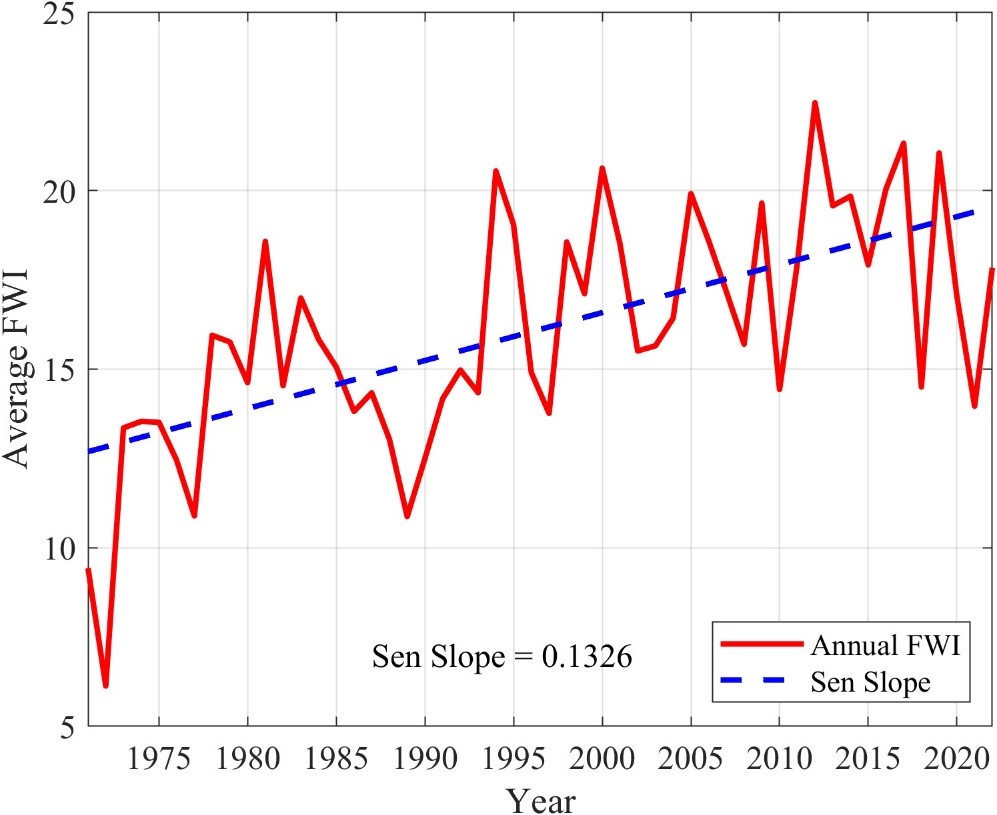
Evolución del Fire Weather Index (FWI) en la Península Ibèrica mediterrània (1971-2022).
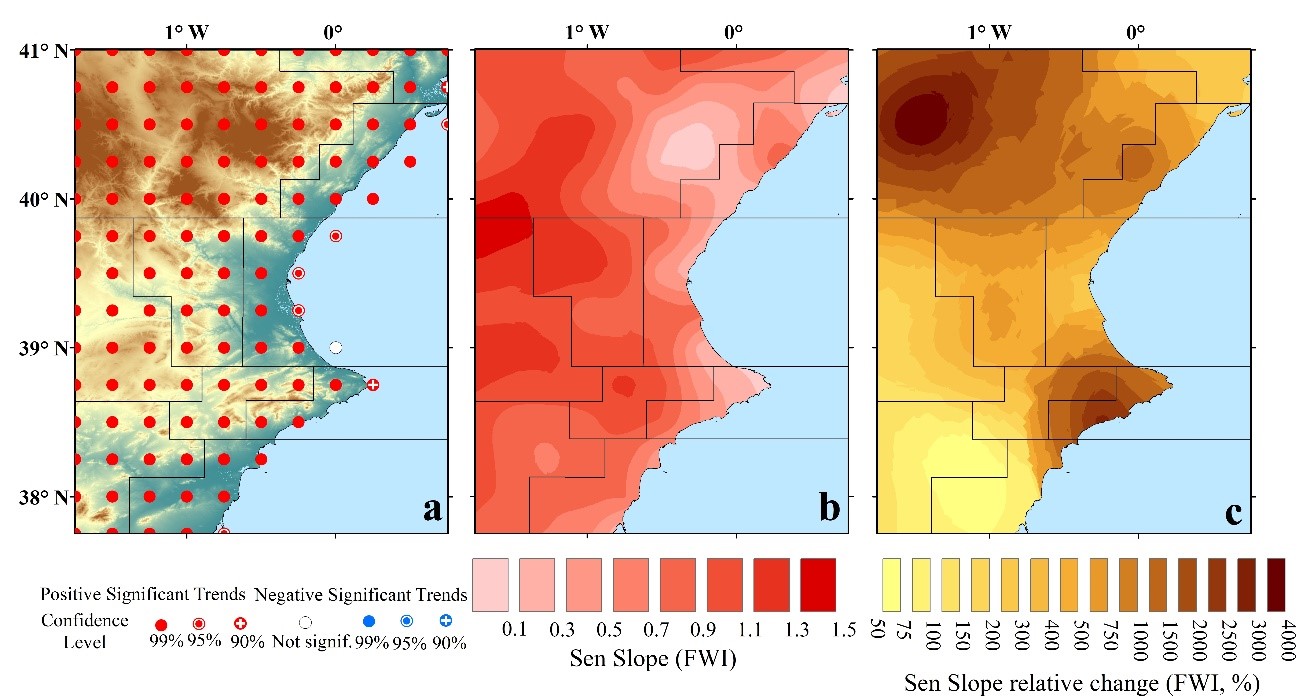
Spatial distribution of the Fire Weather Index (FWI) trend in the Mediterranean Iberian Peninsula
- GVA - PROMETEO - Research groups of excellence