Tool4Extreme
PID2020-118797RB-I00
Extreme weather events have been intensified over the last years, and warming trends and rainfall pattern changes at regional and local scales have been revealed in the Iberian Mediterranean Basin (IMB). The objectives of this multidisciplinary and interdisciplinary project are: the evaluation of climate change trends, for the entire IMB, mainly in terms of two Essential Climate Variables (ECV, defined by the Global Climate Observing System), i.e., temperature and precipitation; the monitoring of these variables with ground-observed and satellite data, and their forecast at short to medium terms; and the study of associated extreme events and trend impacts. For these purposes, reconstruction-homogenization of observed data, remote sensing, modeling and forecast advanced techniques will be used in the project. To achieve these objectives, which are fully framed within the challenge 5 of "Climate change and efficiency in the use of resources and raw materials", the main contributions and novelties of the project research will be: (1) the study of local trends in the entire IMB, which implies more variability of conditions and change patterns, and their impacts; (2) the development of new advanced techniques, both of remote sensing for a wide set of satellite missions (including the most recent ones) and of reconstruction of observed series and downscaling; (3) a complete set of climate variables retrieved from satellite data (precipitation, land and sea surface temperatures, surface air temperature, vegetation indexes, soil moisture and vegetation water content); (4) the monitoring of climate variables with ground observed data and satellite products for long periods; (5) the forecast of daily temperatures and precipitations at high spatial resolution for short and medium terms; (6) the study and forecast of extreme events, cross comparisons between statistical and mesoscale models, and ground and satellite data; (7) the analyses of temporal series of sea surface temperatures due to the observed impact on precipitation; and (8) the study of trends in tropical nights and in the related urban heat island effects. Thus, the project will provide, in addition to new scientific-technical advances, tools (change cartographies, impact indexes and forecasts) to improve the management of the effects of climate change in the IMB and the warning systems of extreme events, for the activation of social and environmental intervention protocols. To achieve these goals, the project relies on the collaboration of both public administrations and national and international entities of relevance in the fields of climate change and Earth observation satellites.
remote sensing, climate change, climate trends
- Niclos Corts, Raquel
- PDI-Catedratic/a d'Universitat
- Coordinador/a de Programa de Doctorat
- Estrela Navarro, Maria Jose
- PDI-Catedratic/a d'Universitat
- Valor I Mico, Enric
- PDI-Catedratic/a d'Universitat
- Dega/Degana / Director/a Ets
- Coll Company, Cesar
- PDI-Catedratic/a d'Universitat
- Director/a Titulacio Master Oficial
- Garcia Santos, Vicente
- PDI-Titular d'Universitat
- Secretari/a de Departament
- Garcia Ten, Alejandro
- PI-Invest Formacio Predoc Fpu
Lluís Pérez Planells (Karlsruhe Institue of Technology, Alemania)
Igor Gómez Doménech (University of Alacant)
María Yolanda Luna Rico (Agencia Estatal de Meteorología)
Fernando Belda Esplugues (Agencia Estatal de Meteorología)
Deliang Chen (University of Gothenburg, Suecia)
Frank Michael Göttsche (Karlsruhe Institue of Technology, Alemania)
Raúl Eduardo Rivas (Instituto de Hidrología de Llanuras, Comisión de Investigaciones Científicas, Argentina)
María Jesús Barberà Bisbal (VAERSA)
Raquel Niclòs
Earth Physics and Thermodynamics Department
Faculty of Physics
Burjassot Campus. C building.
C/. Doctor Moliner, 50.
46100 Burjassot - Valencia (Spain)
E-mail: Raquel.Niclos@uv.es
Earth Physics and Thermodynamics Department Secretary
Phone: (+34) 96 354 43 50
Fax: (+34) 96 354 33 85
REFERENCE DATA ACQUISITION AND CALIBRATION/VALIDATION OF SATELLITE SENSORS AND SATELLITE RESULTS OF LAND SURFACE TEMPERATURE
Throughout this project, the team has taken radiometric measurements with thermal radiometers in experimental areas (like the Valencian rice fields or a leafy scrubland at Cortés de Pallás). Using these data recently launched thermal sensors (such as the L9 TIRS-2 and the Sentinel-3A/B SLSTR) have been calibrated and different satellite land surface temperature (LST) obtained results were validated.
The validation activities are needed to stablish the real precision and accuracy of the satellite LST estimates. The following pictures shows validation zones of the LST products used in the Iberian Peninsula. In each area, the surface emissivity is measured according to its own nature and the seasonal evolution of the vegetation. Thus, the R-based LST data validation method can be applied to the information provided by different satellites (EOS-MODIS, Sentinel-3 SLSTR, MetOp AVHRR/3, etc.) from a variety of areas throughout time.

Satellite land surface temperature (LST) validation data areas in the Iberian Peninsula.
The LST data of the MODIS (Terra and Aqua) MD11 and MD21 satellite has been validated. The global results indicated a systematic deviation within ±0.5 K and a standard error of about 1.0 K for both products, which confirms the great quality of the MODIS LST data (Coll et al. 2024; https://doi.org/10.1109/TGRS.2024.3454377).
The following figure shown the validation results of different algorithms used to obtain the LST from the data provided by the satellite sensor Landsat 9-TIRS2, both the data originally provided by NASA as well as the ones posteriorly provided by the reprocessing generated in 2023 (Niclòs et al., 2023, https://doi.org/10.1016/j.jag.2023.103576).
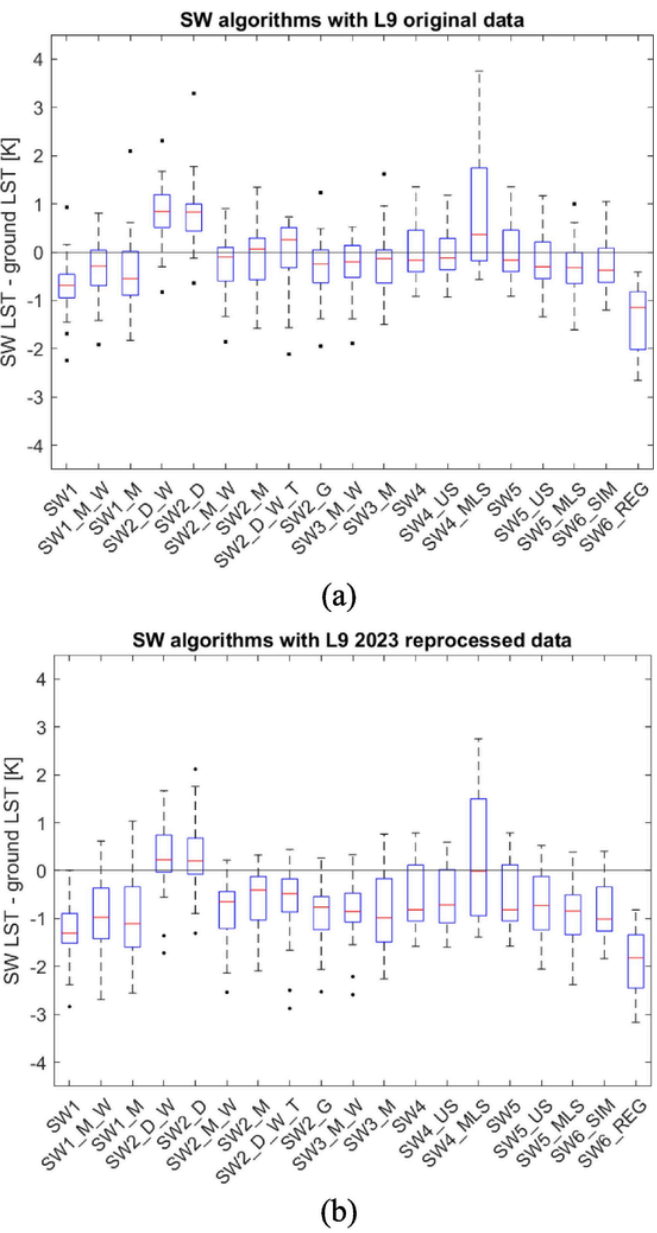
Validation results of different algorithms used to obtain the LST from the data provided by the satellite sensor Landsat 9-TIRS2, both the data originally provided by NASA as well as the ones posteriorly provided by the reprocessing generated in 2023 (Niclòs et al., 2023, https://doi.org/10.1016/j.jag.2023.103576).
A new SW emissivity dependent algorithm has been validated for the SLSTR sensors on board of the Sentinel-3A and 3B sensors in the rice fields region of the Albufera de Valencia, and it has been compared with the LST results provided by Copernicus. In order to do so, data acquired in situ from a permanent station with a broadband thermal infrared radiometer have been used. The following figure shows the most relevant results of the validation.
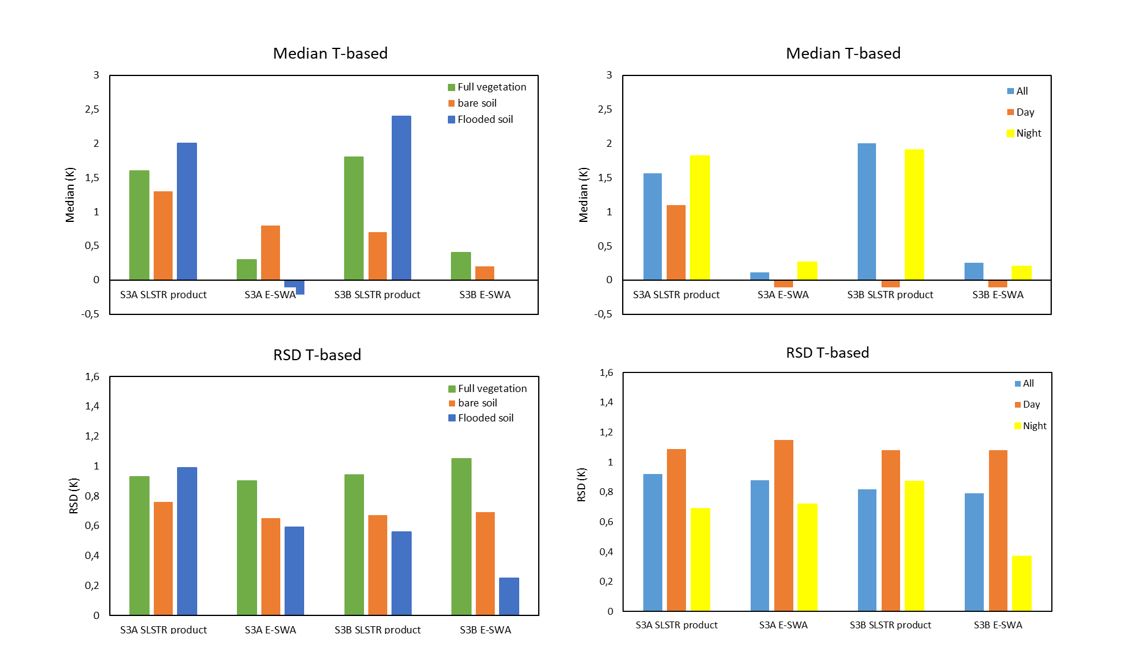
Validation results of the new SW algorithm developed for the SLSTR sensor on board of the Sentinel-3A and 3B platforms, and it comparison with the operative results provided by the Copernicus system.
The validation results for the alternative algorithm presented a systematic uncertainty (median) of 0.11 and 0.25 K and an accuracy (robust standard deviation, RSD) of 0.88 and 0.79 K for Sentinel-3A y -3B, respectively. For the LST SLSTR operational results the following were obtained: a systematic uncertainty of 1.56 and 2.0 K, and an accuracy of 0.92 y 0.82 K for Sentinel-3A y -3B, respectively. There were no significant differences observed between the data of each platform. Both platforma (Sentinel-3A and -3B) reach the GCOS threshold (<1K) for the RSD but not for the median, for which it goes over the stablished threshold.
Data from the CCI initiative of the European Space Agency has been validated, as the following figure shows. We are currently involved in the Climate Research Group (CRG) of the CCI LST project.
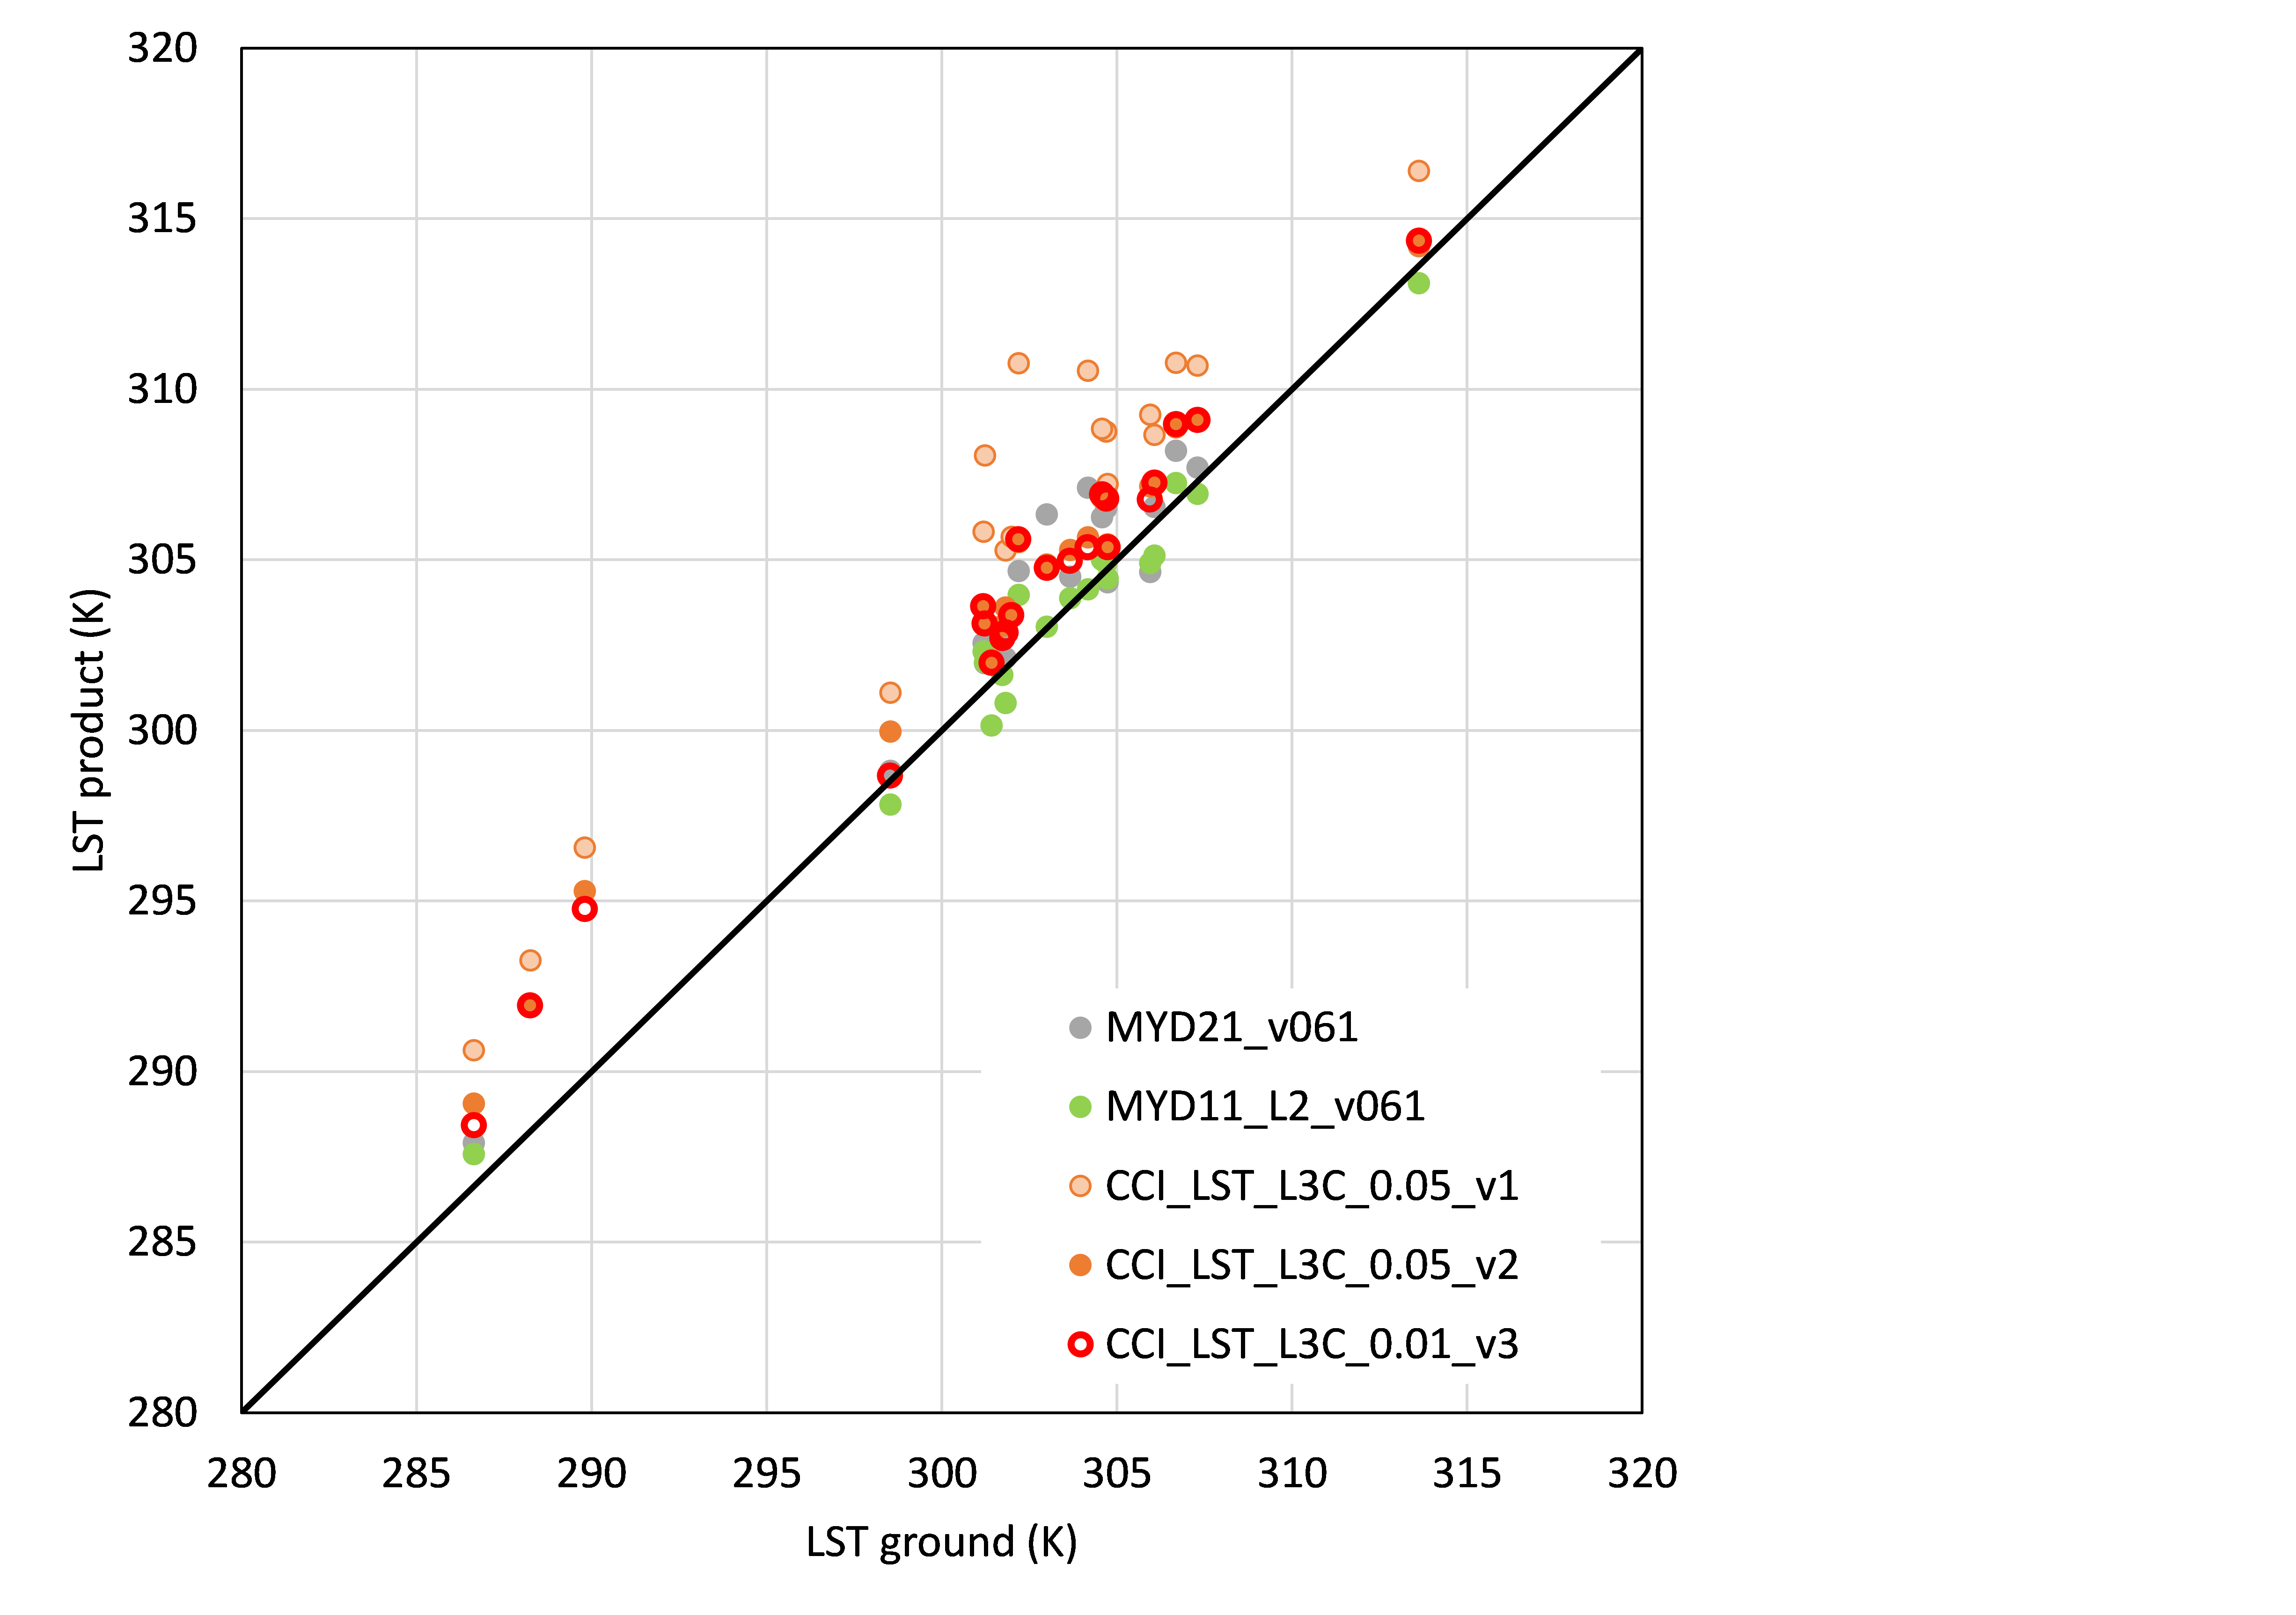
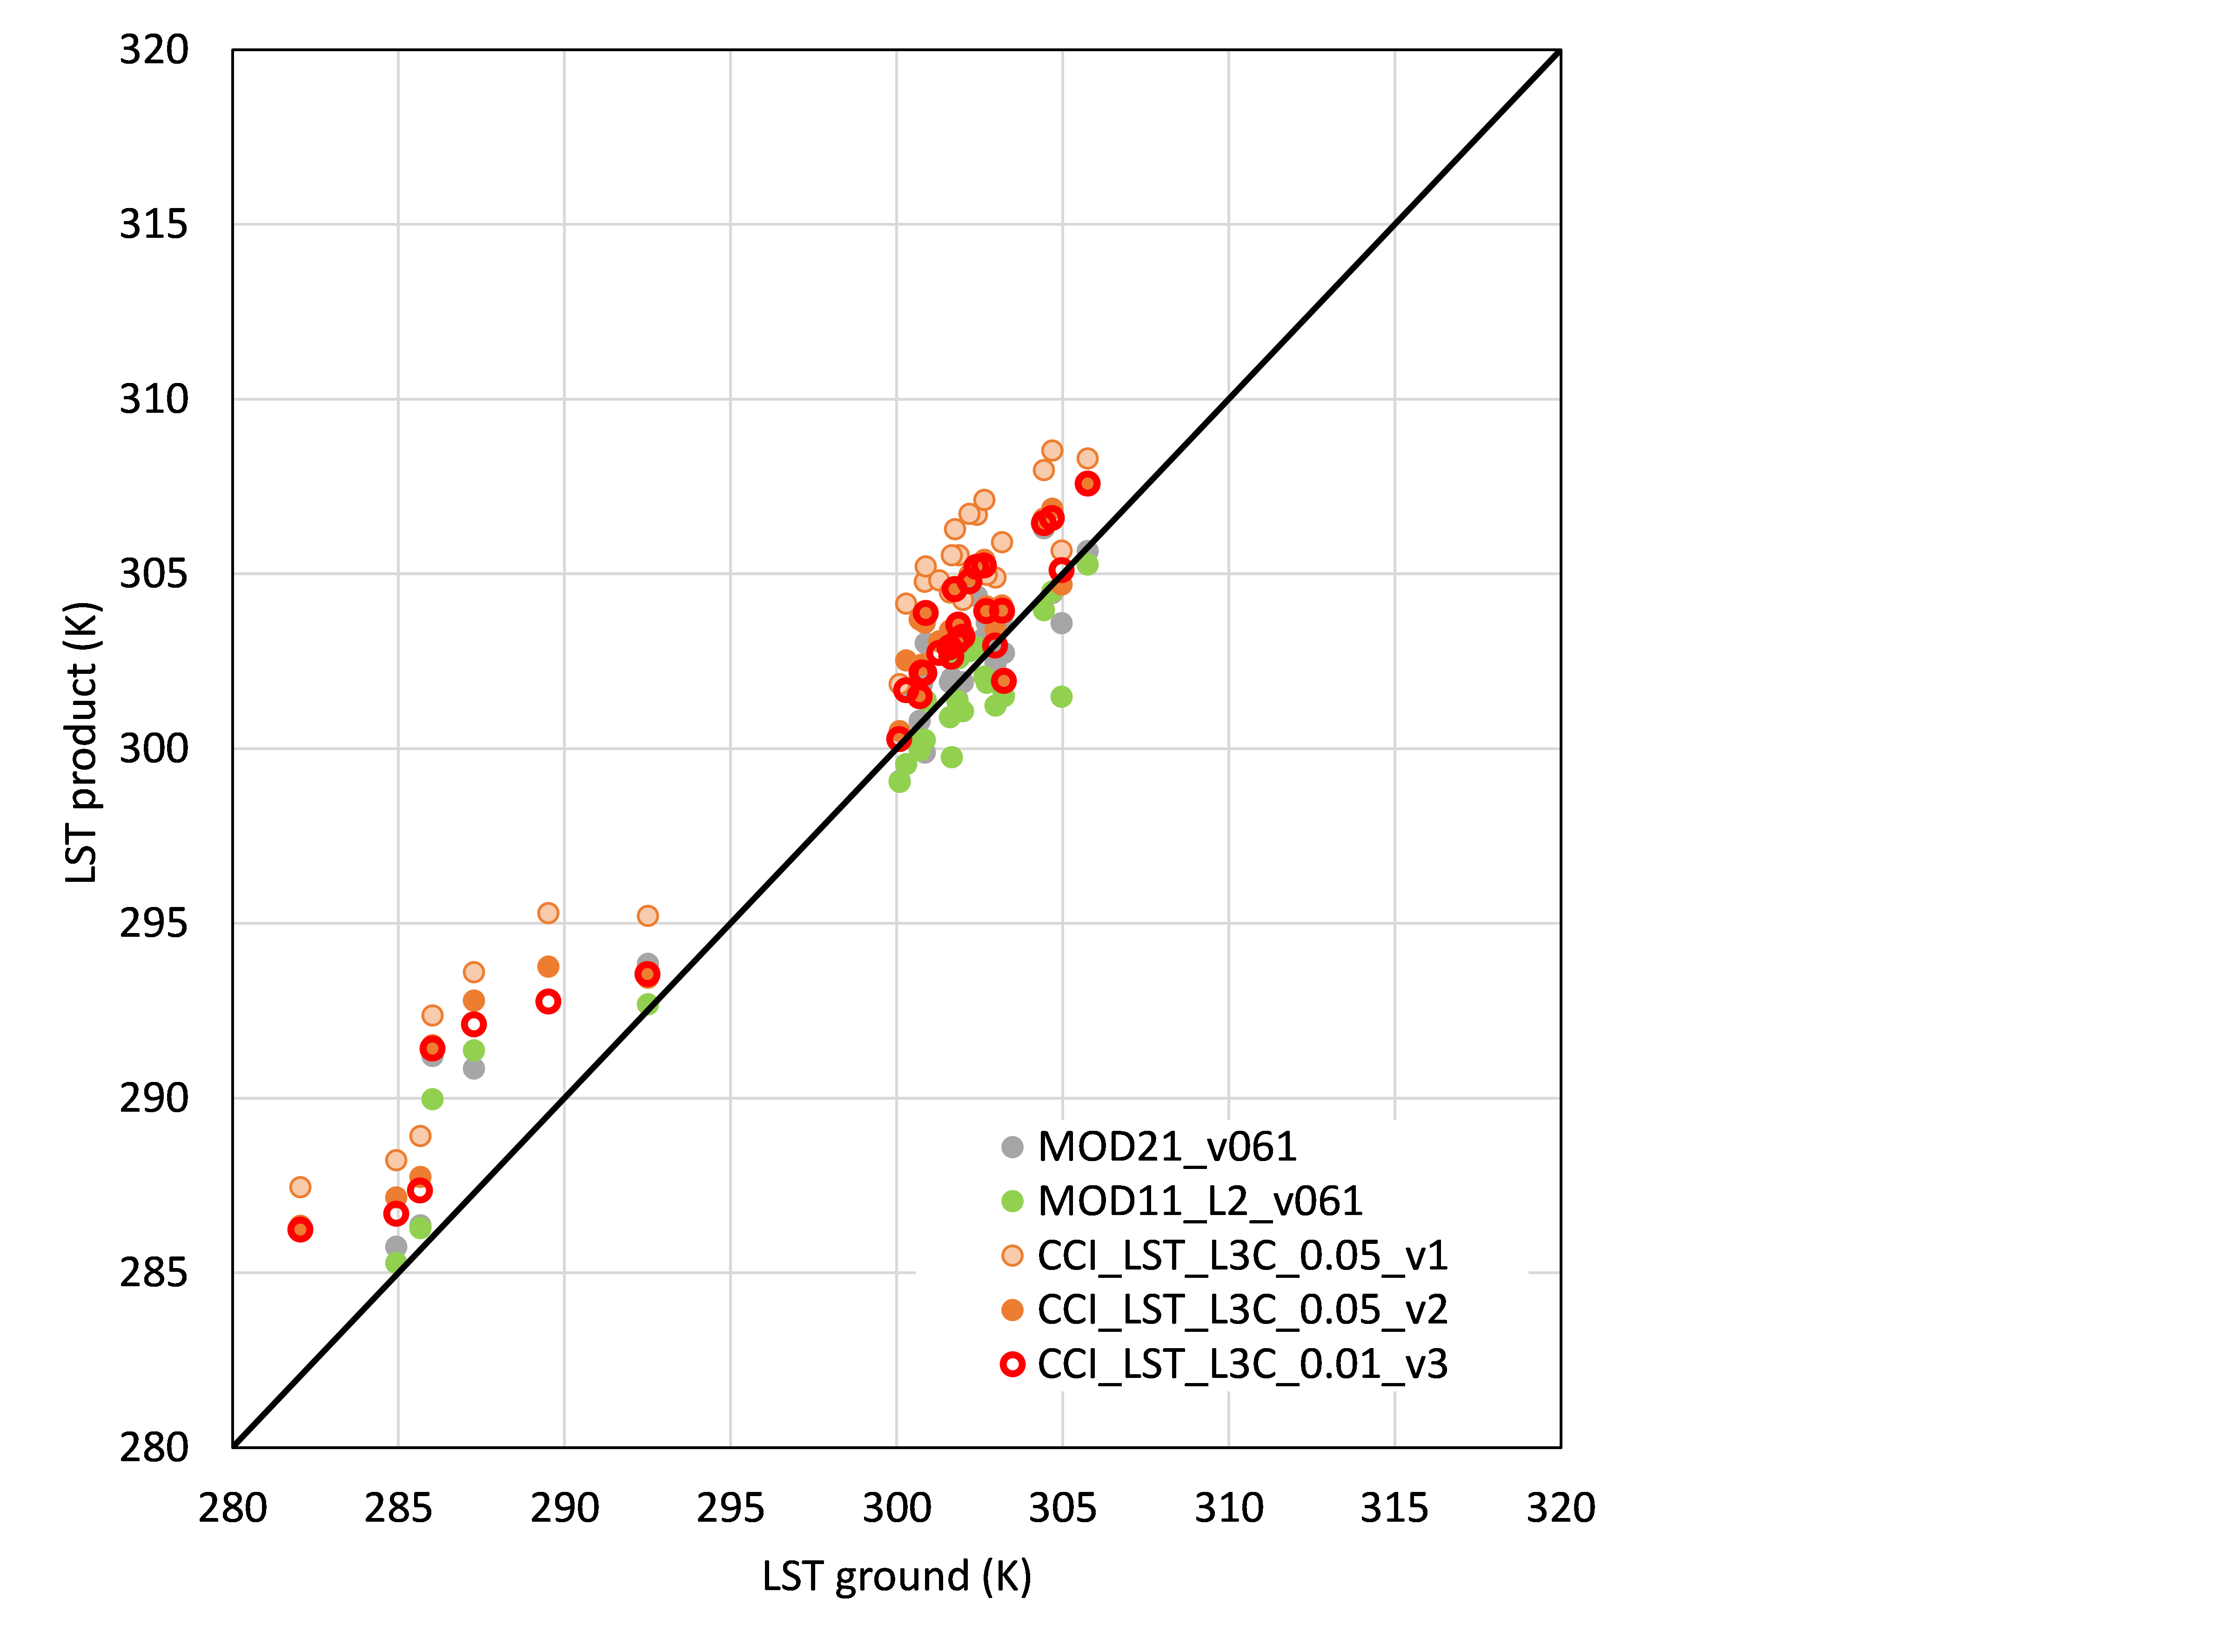
Evaluation of the LSTs obtained from the MODIS data in EOS-Aqua (left) y EOS-Terra (right) using operative results (MYD/MOD21, with TES type algorithm, and MYD/MOD11_L2, with split-window type algorithm) and results from the CCI ESA LST initiative (versions 1 and 3) against the true-field data acquired with radiometers throughout transects of the experimental area of the rice fields close by to the city of Valencia (Niclòs et al., 2022; Good et al., 2022).
VALIDATION OF THE SATELLITE PRECIPITATION ESTIMATION RESULTS
The accuracy of multiple precipitation measurement products over the eastern side of the Iberian Peninsula has been analysed, mainly the CMORPH, IMERG and MSWEP products, through its comparison with precipitation field measurements corresponding to the AEMET rain meter network. The analysis of these products was carried out after revising the characteristics of the different models and products available in the bibliography. The result of the analysis suggest that the most appropriate method, in relation with the area of study, is the MSWEP method, results of which are shown in the following figure in RMSE terms against the AEMET data.
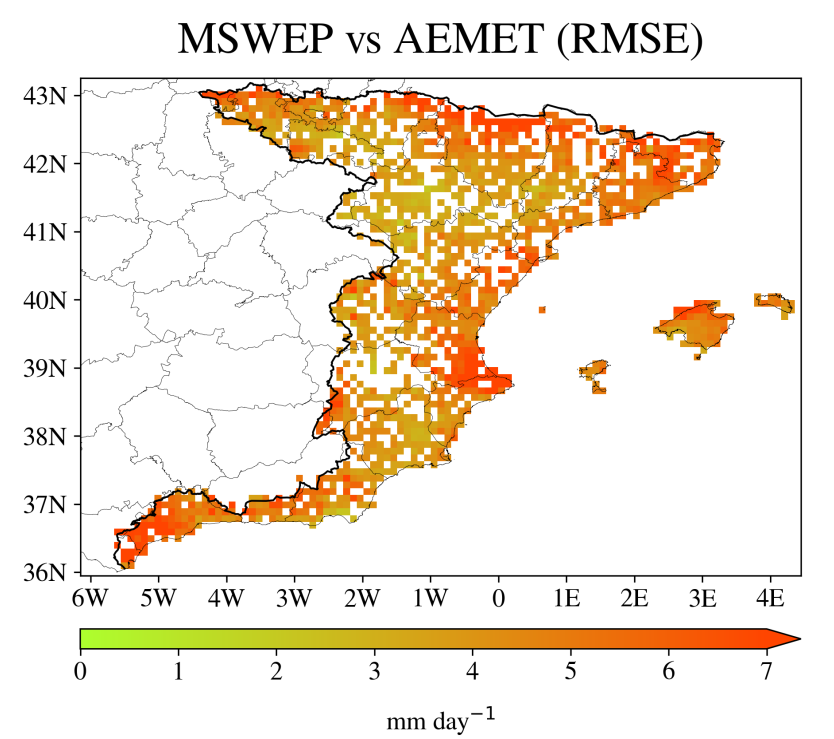
MSWEP RMSE error distribution against the AEMET stations data (averaged by pixel) at a daily level for the 1979-2020 period (García-Ten et al, 2023).
VALIDATION OF SATELLITE SOIL MOISTURE ESTIMATION RESULTS
The Soil Moisture (SM) is a key hydrological variable that shows the water content at any specific ground layer. Its study is essential for numerous meteorological, climatological and hydrological applications, as well as for the prediction of extreme climate events. One of the consequences of the variability in precipitations is the change in soil moisture levels, which directly affects its quality, farming viability and irrigation necessities. Thus, a global SM satellite monitoring is essential, reaching an adequate spatial and temporal resolution.
It has been validated and compared as well a group of teledetection products which goal is to measure the soil moisture with satellites, specifically the superficial SM data of various spatial sensors (ASCAT, SMAP, SMOS and CCI) through field observations in the northeast of the Iberian Peninsula and in the south of France during a period of 7 years (2015-2022). The results show that SMAP is the most consistent and accurate mission, followed by the CCI. Meanwhile, ASCAT and SMOS give greater uncertainties and less correlations, respectively, as it is shown in the following figure.
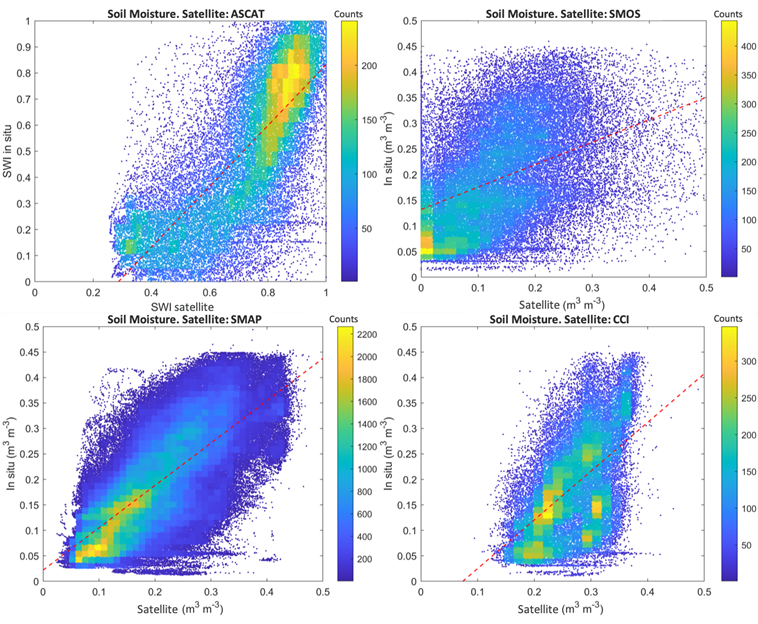
Dispersion and lineal adjusting diagrams resulting from the validation between in situ SM measurements and satellite results.
OBTAINING THE AIR TEMPERATURE FROM LST SATELLITE DATA
Air temperature at a surface level is categorised as an essential climate variable by the Global Climate Observing System (GCOS), which highlights the importance of its monitoring in the current climate change context. Nowadays, measurements for this temperature are mainly obtained from meteorological stations, in other words, spatially discrete data.
In order to continuously study this variable, the air temperature in this project was obtained from satellite date, reanalysis data and geographical and topographical data. Three different methods were implemented with the objective of comparing them and determining the most accurate one: previously published equations, linear methods and non-linear methods.
In the attached figure we can observed the uncertainties (Relative Root Mean Squared Error, RRMSE) of the most precise models for each of the methods. For the previously published equations, we have the D.6 and N.1 expressions published in Niclòs et al. (2014). For the linear methods, the OLS (ordinary least squares). Finally, for the non-linear methods, the XGB methods (eXtrme Gradient Boosting).
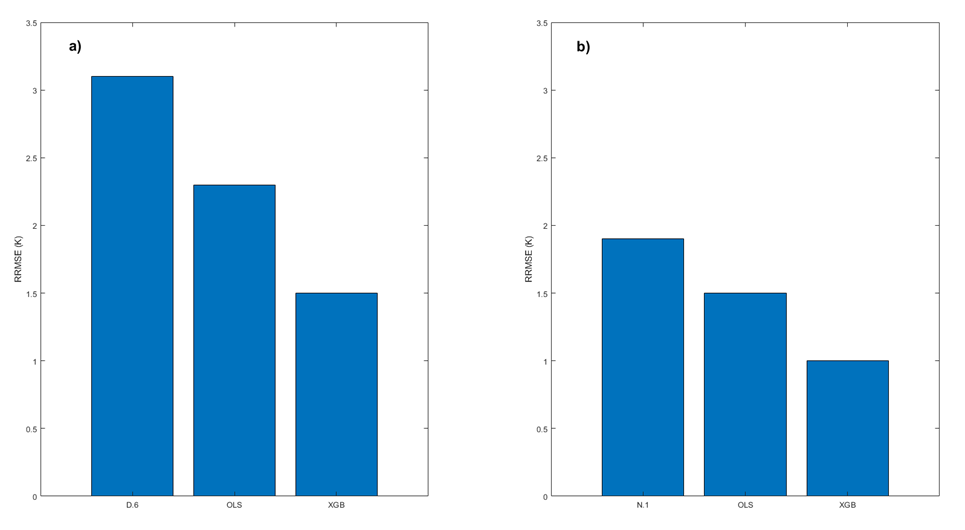
Relative Root Mean Squared Errors of the different analysed models to obtain the day and night SAT (Vedrí et al., 2025; doi.org/10.1016/j.jag.2025.104380)
Both for day (a) and night (b) temperatures, the non-linear XGB method is observed to be the most accurate to obtain surface level air temperature results.
ANALYSIS OF SUPERFICIAL LAND TEMPERATURE TRENDS
Throughout this project we have analysed superficial land temperature trends from the ESA Climate Change Initiative LST (LST_CCI) results derived from the EOS-Aqua MODIS data. These trends are shown in the following figures. Increasing trends are seen for the temperature of the 2002-2018 period. These trends are significant at an annual level in over a fifth of the Iberian Peninsula during the day, with an average of 0,10⁰C/year, and in over a third during the night, with an average of 0,07⁰C/year. The following figure shows, as an example, the trends observed during the winter months, in which there have been significant temperature increases.
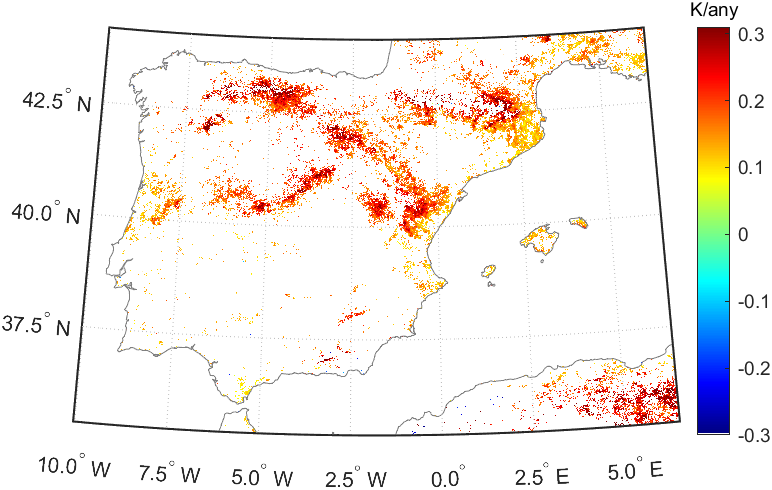
Figura A
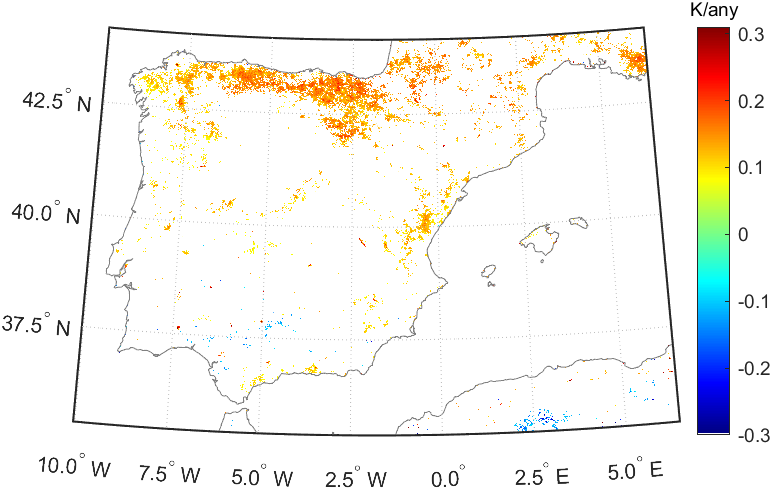
Figura B
LST trends during the day (a) and night (b) at the Iberian Peninsula in winter between 2002 and 2018, obtained from the LST results of CCI derived from the EOS-Aqua MODIS data (1 km spatial resolution).
ANALYSIS OF TRENDS DURING TROPICAL NIGHTS
Likewise, we have analysed the trends during tropical nights. Tropical nights are those in which the minimum temperature does not go below 20°C. In the Iberian Peninsula, when analysing air temperature data from the last 70 years, we observe an increase of this type of nights, as shown in the following figure. The trends mainly appear at the Mediterranean coast and the Guadalquivir and Ebro valleys, where they can reach values greater than 5 days per decade, meaning, an increase of over a month of tropical nights since the beginning of the study.
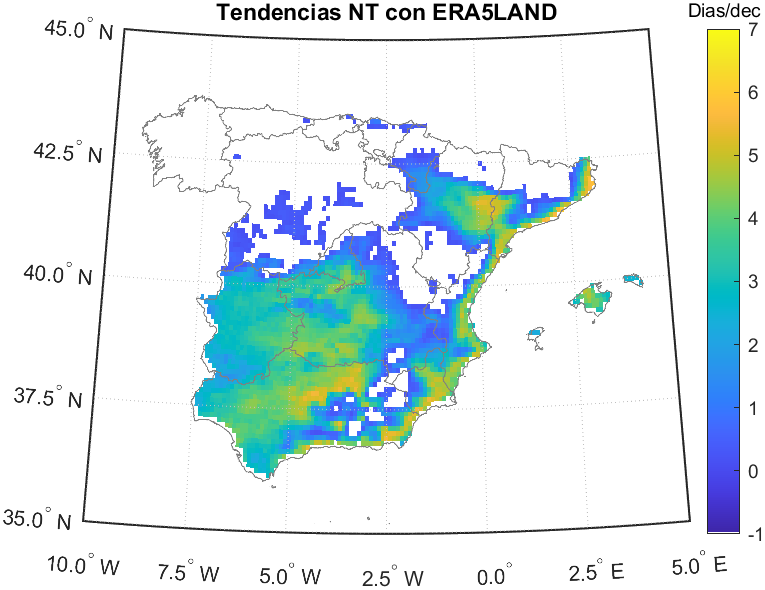
Trend of tropical nights increase per decade during summer in the Iberian Peninsula. Study made with the data from the last 70 years of the ERA5-Land product (5 km spatial resolution).
ANALYSIS OF PRECIPITATION TRENDS AND EXTREMES
We have analysed, with an specialised method, the precipitation extremes in the Peninsular area, particularly the trends in droughts and torrential rains. The following figure shows the changes in the intensity of precipitations.
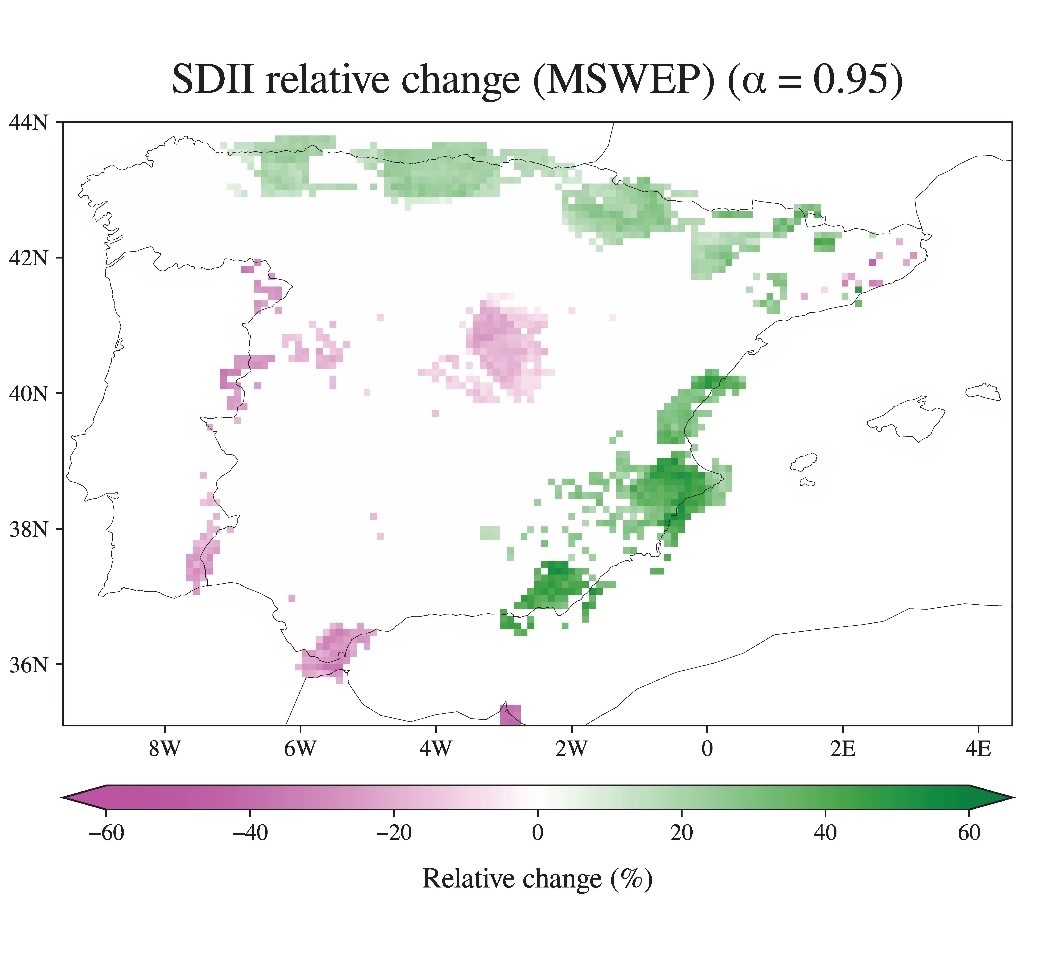
Relative change (trend multiply by the number of years and divided by the average value) in the Simple Day Intensity Index (annual precipitation divided by the amount of humid days) using the MSWEP data for the 2001-2020 period.
We can appreciate how the amount of torrential rains has increased in a good chunk of the northern coast, the interior of the Ebro basin, in the whole Valencian Community and in Almeria, while it has reduced in Cadiz, in the Inner Plateau and in some areas of the border with Portugal. The most noticeable changes occurred at the Mediterranean coast, with increments of up to a 60%, which urges to increase the precautions for extreme events.
PRECIPITATION TRENDS IN THE OBSERVED DATA: DROUGHTS AT THE HEADWATERS OF OUR RIVERS
The headwaters of our rivers are drying up. Through a study using the data from a period of the 70s, we have detected a considerable loss of precipitations in two key areas for the Valencian Community: the area of the Iberian System, which has the source of the Júcar and Turia rivers, and the area of the Betic System, where the Segura river is born. In addition, these areas also have the sources of rivers like the Tajo and Guadalquivir, waters of which flow into the Atlantic ocean and are crucial for the regions which they flow through
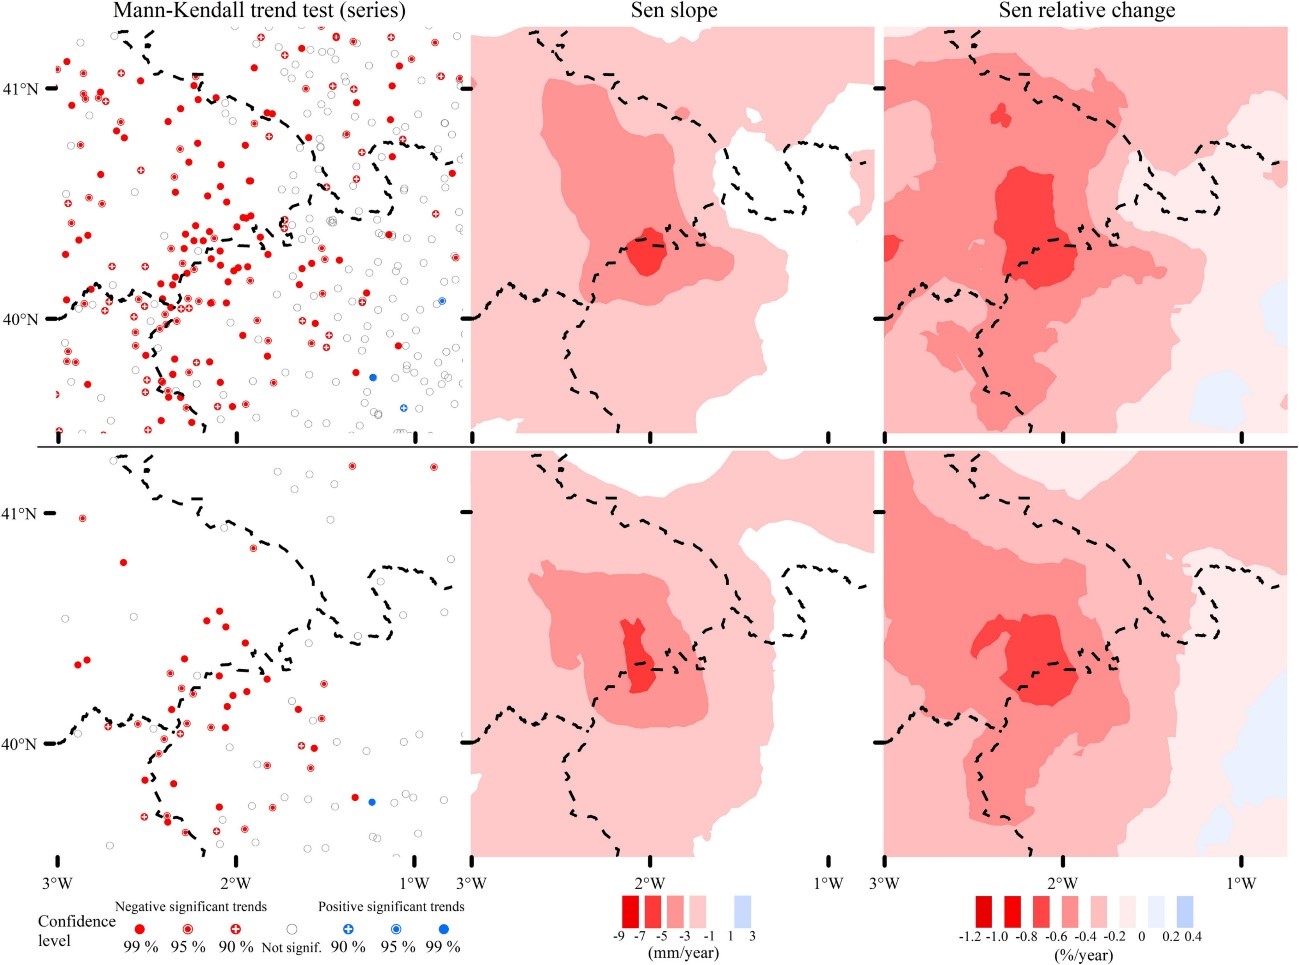
Significant trends (1952-2021 period), pending of change in the annual precipitations volume (in mm/year and relatives) for the Iberian System (Miró et al., 2023; https://doi.org/10.1016/j.atmosres.2023.106695).
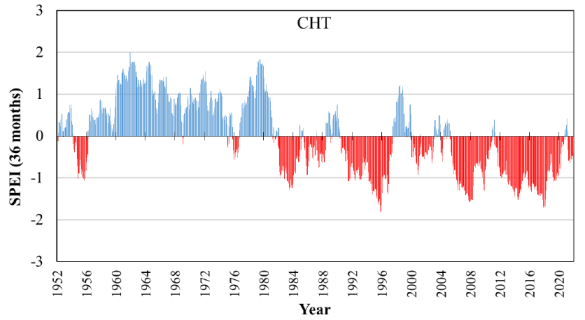
Temporal series of the daily average SPEI values in a 36 month temporal scale for the 1952-2021 period and all the meteorological stations of the Confederación Hidrográfica del Tajo (Hydrographic Confederation of the Tajo) (Miró et al., 2023; https://doi.org/10.1016/j.atmosres.2023.106695)
HOW WILL THE TEMPERATURES IN SPAIN CHANGE IN THE FUTURE?
Climate change is transforming our planet, and Spain is no exception. According to the projections obtained from 16 climate models from the Euro-CORDEX initiative, temperatures will keep on increasing during the following decades. These forecasts, which reach a 10 km spatial resolution, allow us to better understand the expected changes at a regional level.
According to the data, the interior of the Peninsula will suffer the greatest maximum temperature increase, specially affecting regions such as Madrid, Castilla y León, Castilla-La Mancha and Extremadura. In these areas, the warming will be more severe during the first few decades of the century, reaching its highest point halfway through the century to then stabilise itself.
Conversely, northern Spain regions (Galicia, Asturias, Cantabria and the País Vasco), together with the Balearic Islands, will see a more moderate warming, although it will be maintained until the end of the century.
If we analyse each season independently, projections show that summer and autumn will suffer the most significant temperature increases. In the near future, autumn is expected to have the greatest increase, while in the medium and distant future, summer will be the season wit the biggest increases.
On average, autumn could register a 3.4 C increase, and the Comunidad de Madrid will be the most affected, with an maximum increase of up to 3.8 C.
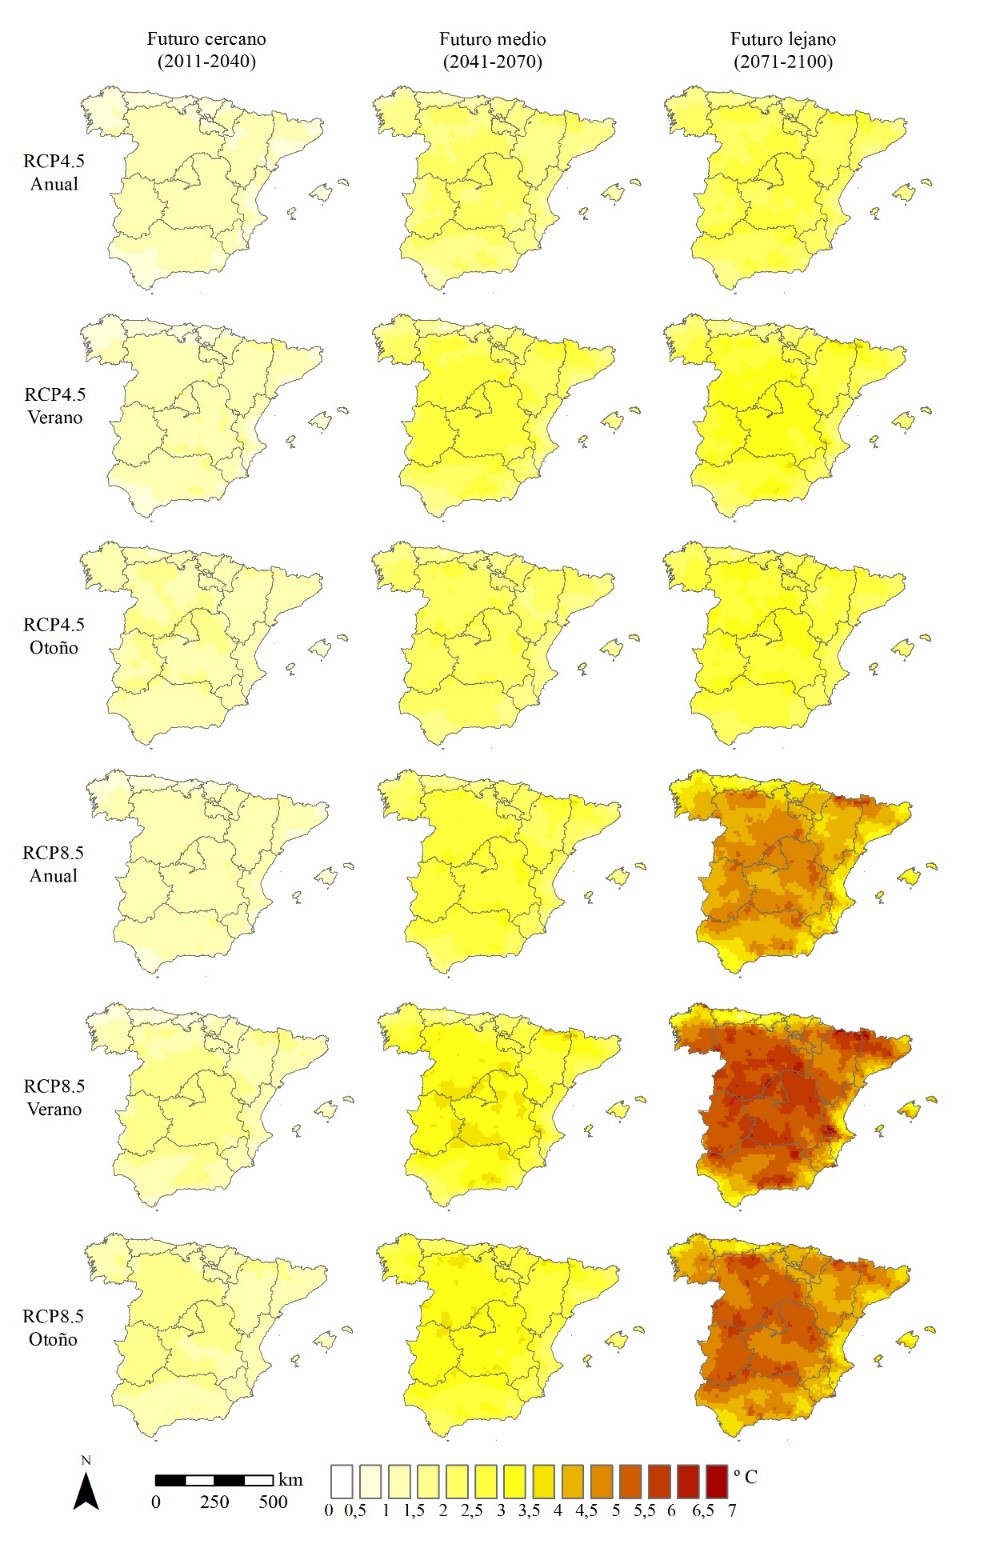
Annual maximum average temperature (ºC) average change of summer (JJA) and autumn (SON), for the 2011-2040 (left), 2041-2070 (centre) y 2071-2100 (right) periods regarding the reference period (1971-2000) in the RCP4.5 scenario. Data extracted from dynamic regionalisation’s generated by the Euro-CORDEX initiative (https://cordex.org/) with regional climate models, which provide grid data with an approximate resolution of 10 km (data obtained from AdapteCCa).
- MCiencia - Innovation


