
.jpg)
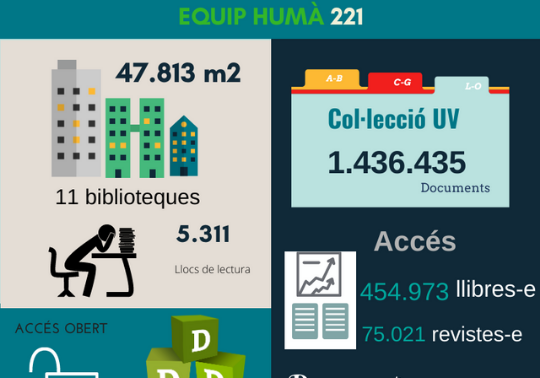
We want to present the Servei de Biblioteques i Documentació 2019 figures in graphic form, with the help of a visual infographic. You can see the data in the "Statistics" section of the Quality and Evaluation section of our website, where you will also find a more complete statistical data table with data from 2015.
First, we present the human data, users and library staff. Then, the square meters dedicated to the library and the available reading places. The Universitat de València collection is the next protagonist, with books and journals on paper and electronic, documents before 1900, incunabula and manuscripts.
The open access present to the RODERIC Repository, with the digital objects and the theses deposited in 2019, is the following section, before the usage data of our collection: physical books loans and articles and electronic chapters downloads.
Training data are showed in the infography, with the number of courses and assistants, and the data of a classic service to our libraries: the interlibrary loan service, with the number of loans between Spanish and foreign libraries.
Finally, the economic expense of our service in information resources and, specifically, in electronic information for the year 2019.